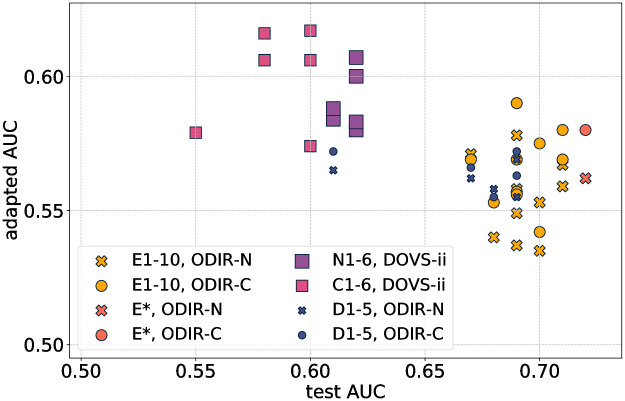
Fig 5. A graphical representation of the domain adaptation results for the models developed in this work.
On the x-axis is a model’s AUC score on the test partition from the database on which it was trained; on the y-axis, its domain-adapted AUC score. Points labelled D1–5 correspond with models trained and evaluated on DOVS-i; E1–10, DOVS-ii; N1–6, ODIR-N; C1–6, ODIR-C. The ensemble model is denoted E*. The marker radius of the plotted points corresponds with the number of images in the database used for model development (cf. Table 1). Each point is coloured according to the database on which the associated model was trained, and the shape of each point corresponds with the database on which that model was evaluated for its domain-adapted AUC score.

