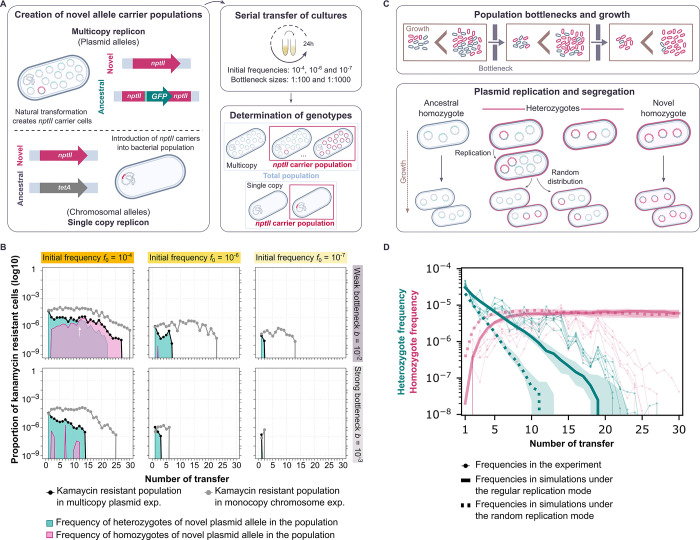
Fig 1. Integrating multicopy replicon allele dynamics in vivo and in silico.
(A) Our experimental system enables us to create and follow bacterial populations encoding a novel allele in a plasmid or chromosomal replicon over the course of an evolution experiment. The novel allele employed is a kanamycin resistance gene (nptII), which encodes aminoglycoside 3’-phosphotransferase II [49]. The ancestral plasmid allele is a green fluorescence protein (gfp) whose transcription is under the control of a LacI repressor [28]. The chromosomal ancestral allele is a tetracycline resistance gene (tetA). The bacterial populations were serially passaged under different experimental conditions for approximately 200 generations. The frequency of cells carrying the novel allele was followed by selective plating on kanamycin-containing medium, where each viable cell will form a colony. For the plasmid replicon, the presence of both ancestral and novel allele, that is homozygotes and heterozygotes, was distinguished due to fluorescence conferred by the ancestral allele. Bacterial colonies were visually inspected employing blue light. Note that this is an assessment between homozygotic and heterozygotic colonies rather than an exact quantification of the number of alleles present. (B) Allele dynamics of representative populations evolved under non-selective conditions. The white arrow marks the point at which the frequencies of heterozygous and novel homozygous cells are equal. The plots start at the end of the first day of growth, where the final transformant frequencies, according to the amount of donor DNA added, have been achieved. The remaining experimental populations are shown in S3 and S4 Figs. (C) Schematic diagram of the mathematical model of plasmid allele dynamics under periodic population bottlenecks (transfers). Bacterial populations grow until they reach a carrying capacity Nc before each transfer. A proportion b of cells is randomly chosen for the next growth phase. During each growth phase, cells carrying only the ancestral allele (ancestral homozygotes) replicate at a rate that is 1-s times smaller than the rate of cells carrying the novel allele (heterozygotes and novel homozygotes). (D) Comparison between the allele dynamics in evolution experiments using the pTAD-R plasmid and in model simulations with replicon copy number nrc = 15 under non-selective conditions (s = 0) for high initial frequencies, f0 = 10−4, and weak bottlenecks, b = 10−2. Bold green (red) lines show the median of the heterozygote (homozygote) frequencies before each transfer from 30 simulations for both modes of replication; shaded areas show the corresponding interquartile ranges. Thin lines show the heterozygote frequency from the six replicates of the evolution experiment. Simulation results were obtained by integrating the differential equations for bacterial growth and sampling new populations at each transfer from a multinomial distribution defined by the genotype frequencies at carrying capacity.

