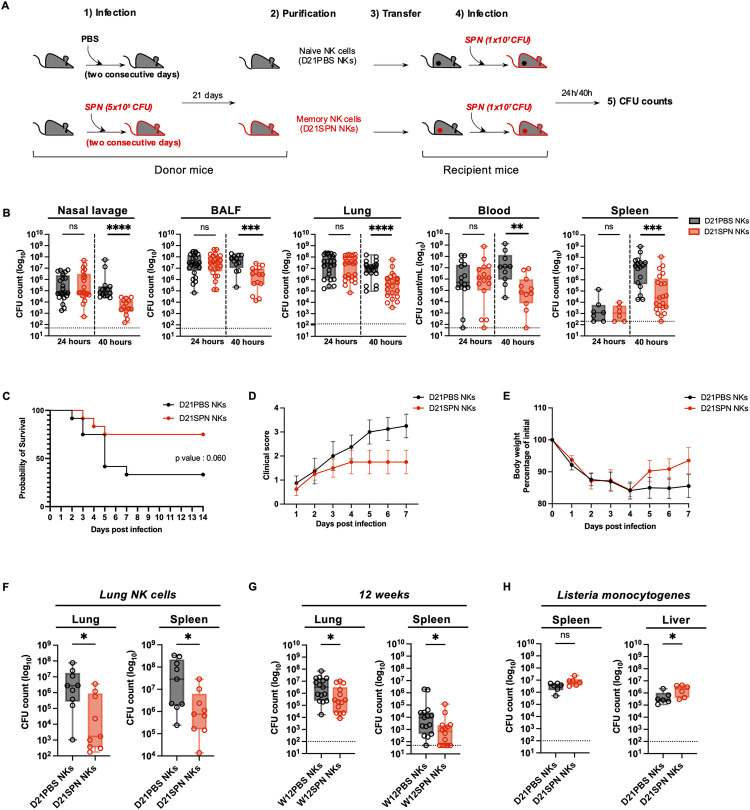
Fig 3. Transferred memory NK cells protect mice from lethal S. pneumoniae infection for at least 12 weeks.
(A) Experimental scheme. C57BL/6 mice (donor mice) were intranasally injected with either PBS (black symbols) or sub-lethal dose of S. pneumoniae (SPN, red symbols, 5x10⁵ CFU) for two consecutive days. After 21 days or 12 weeks, NK cells from spleens or lungs were highly purified (98%) and transferred into naïve mice (recipient mice, intravenously, 2x10⁵ cells). One day after, all recipient mice were intranasally infected with a lethal dose of S. pneumoniae (5x10⁶ CFU for survival study, 1x10⁷ CFU for bacterial counts comparison) or L. monocytogenes (1x10⁶ CFU, intravenously). Organs were collected at 24h and 40h post-infection for CFU counts and flow cytometry analysis. (B) Bacterial counts at 24h and 40h post-infection in the nasal lavage, bronchio-alveolar lavage fluid (BALF), lungs, blood and spleen of mice having received either D21PBS NKs (black symbols) or D21SPN NKs (red symbols). Box plots where each dot represents an individual mouse, lines are the mean, error bars show min to max and dotted lines represent limit of detection. Data are pooled from at least two repeats with n ≥ 3 mice/group. (C) Survival curve. Dots represent the percentage of survival of total mice. Data are representative of three repeats with n = 4 mice/group. (D) Clinical score. Dots represent the mean, error bars show the standard error of the mean (SEM). Data are representative of two repeats with n = 4 mice/group. (E) Weight represented as percentage of initial body weight loss. Dots represent the mean, error bars show the standard error of the mean (SEM). After death, mice have the value of 80%. Data are representative of two repeats with n = 4 mice/group. (F) Bacterial counts at 40h post-infection in the lungs and spleen of mice having received either D21PBS NKs (black symbols) or D21SPN NKs (red symbols) isolated from the lungs of donor mice. Box plots where each dot represents an individual mouse, lines are the mean, error bars show min to max and dotted lines represent limit of detection. Data are pooled from three repeats with n ≥ 3 mice/group. (G) Bacterial counts at 40h post-infection in the lungs and spleen of mice having received either W12PBS NKs (black symbols) or W12SPN NKs (red symbols). Box plots where each dot represents an individual mouse, lines are the mean, error bars show min to max and dotted lines represent limit of detection. Data are pooled from three repeats with n ≥ 4 mice/group. (H) Bacterial counts at 40h post-infection in the spleen and liver of mice infected with Listeria monocytogenes (intravenously) and having previously received either D21PBS NKs (black symbols) or D21SPN NKs (red symbols) from the spleens of donor mice. Box plots where each dot represents an individual mouse, lines are the mean, error bars show min to max and dotted lines represent limit of detection. Data are pooled from two repeats with n = 3 mice/group. ns, not significant. * p < 0.05, ** p < 0.01, *** p < 0.001 **** p < 0.0001. 2way ANOVA (B), Log-rank (Mantel-Cox) (C) and Mann-Whitney (F,G,H) tests for statistical significance.

