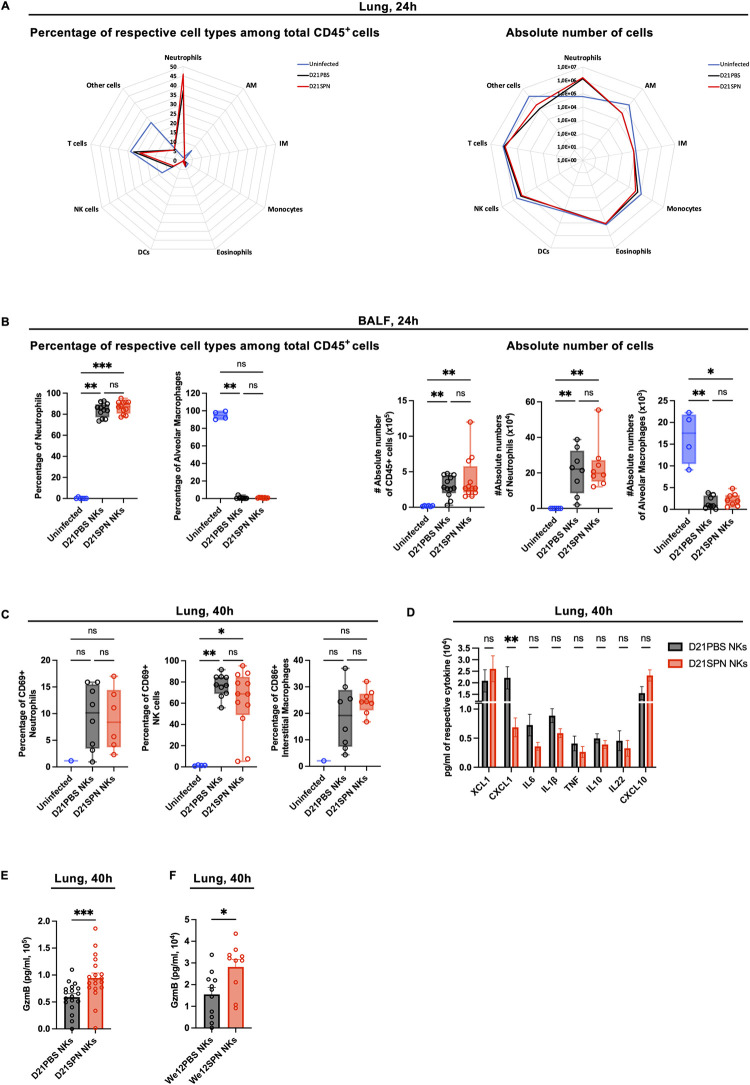
Fig 5. Protection of mice appears to be an intrinsic NK cell property.
Mouse infections are carried out as in the scheme in Fig 3A. Organs were collected at 24h and 40h post-infection for flow cytometry analysis, ELISA assays and CFU counts. (A) Cellular infiltrate analysis in the lungs at 24h post-infection. Percentage of respective cell types among CD45+ cells (left panel) and absolute number of cells for each cell type (right panel): neutrophils (Ly6G+ CD11b+), alveolar macrophages (AM) (Ly6G- SiglecF+ CD64+ CD11b-), interstitial macrophages (IM) (Ly6G- SiglecF- CD11bhigh MHCII+ CD64+ CD24-), monocytes (Ly6G- SiglecF- CD11bhigh MHCII-), eosinophils (Ly6G- SiglecF+ CD11b+), dendritic cells (DCs) (CD103+ DCs: Ly6G- SiglecF- CD11blow CD103+ CD24+ + CD11b+ DCs: Ly6G- SiglecF- CD11bhigh MHCII+ CD64- CD24+), NK cells (NK1.1+ CD3-), T cells (NK1.1- CD3+). Radar plots with each value representing the geometric mean of three repeats with n = 4 mice. The blue line for uninfected mice, black line for mice having received D21PBS NKs and red line for mice having received D21SPN NKs. (B) Cellular infiltrate analysis in the bronchio-alveolar lavage fluid (BALF) at 24h post-infection. Percentage of respective cell types among CD45+ cells (left panel) and absolute number of cells for each cell type (right panel): neutrophils (Ly6G+ CD11b+), alveolar macrophages (SiglecF+ CD64+ CD11b-). Box plots where each dot represents an individual mouse (blue dots for uninfected mice, black dots for mice having received D21PBS NKs, red dots for mice having received D21SPN NKs), lines are the median, error bar show min to max. Date are pooled from at least two repeats with n ≥ 2 mice/group. (C) Cellular activation analysis in the lung at 40h post-infection. Percentages of CD69+ neutrophils, CD69+ NK cells and CD86+ interstitial macrophages. Box plots where each dot represents an individual mouse (the blue dots are for uninfected mice, black dots for mice having received D21PBS NKs, red dots for mice having received D21SPN NKs), lines are the median, error bar show min to max. Data are pooled from two repeats with n ≥ 1 mice/group. (D) ELISA assays of lung supernatants from infected mice at 40h post-infection. Bars are the mean of at least 3 experiments with n ≥ 3 mice/group, error bars are the standard error of the mean (SEM). (E-F) At 40h post-infection, lung supernatants of mice having received either D21PBS NKs (black) or D21SPN NKs (red) (C)—either We12PBS NKs (black) or We12SPN NKs (red) (D) were collected to perform Granzyme B ELISA assays. Bars are the mean of at least 3 experiments with n ≥ 3 mice/group, each dot represents an individual mouse and error bars are the standard error of the mean (SEM). ns, not significant. * p < 0.05, ** p < 0.01, *** p < 0.001. Kruskal-Wallis (A,B,C), 2way ANOVA (D) and Mann-Whitney (E,F) tests for statistical significance.

