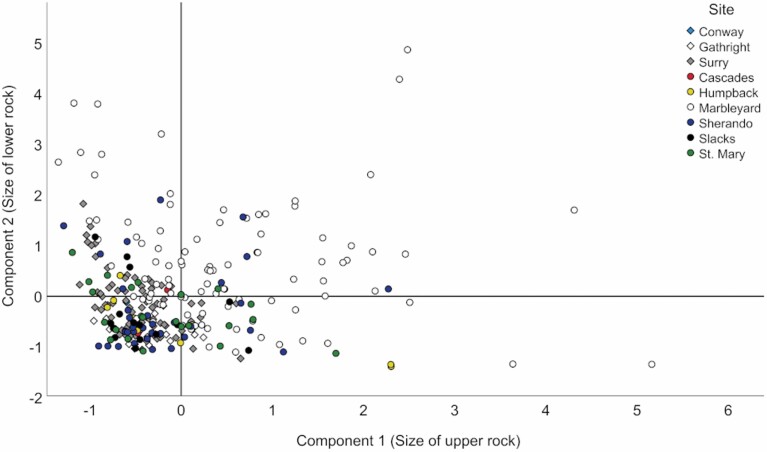
Fig. 3.
Variation in principal component scores within and among rock formations where we studied roost selection by Eastern Small-footed Myotis (Myotis leibii), in New Hampshire and Virginia, 2009–2018. Scores were derived from a principal components analysis of six different rock measurements taken at 156 randomly selected crevices and 164 roosts. Components 1 and 2 correspond to the size of the upper and lower rock forming each crevice, respectively, with the largest rocks represented by strong positive scores.

