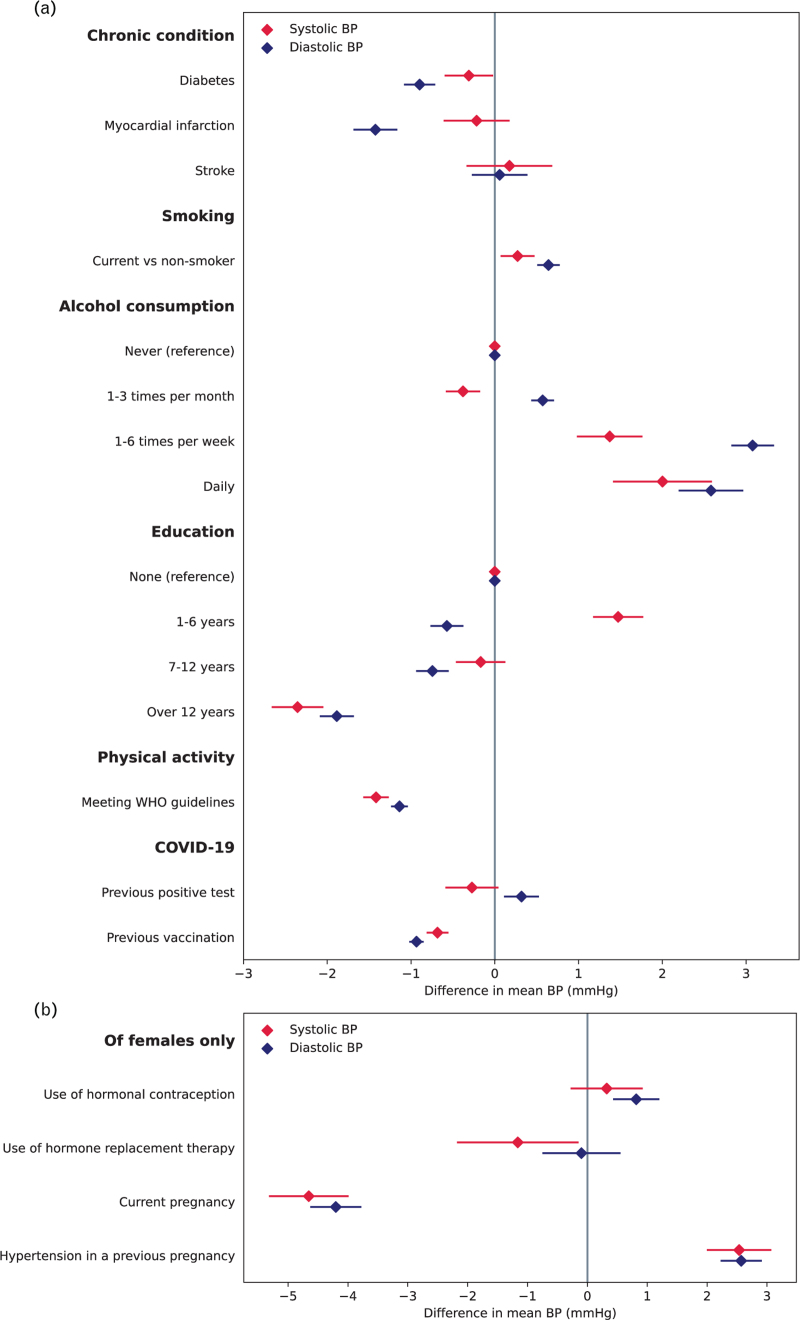
FIGURE 1.
Difference in average SBP and DBP in participants with different risk factors, for whole population (panel a) and of female participants only (panel b). Results from linear mixed models adjusted for age, sex and antihypertensive medication (panel a), or age and antihypertensive medication (panel b).

