Fig. 1.
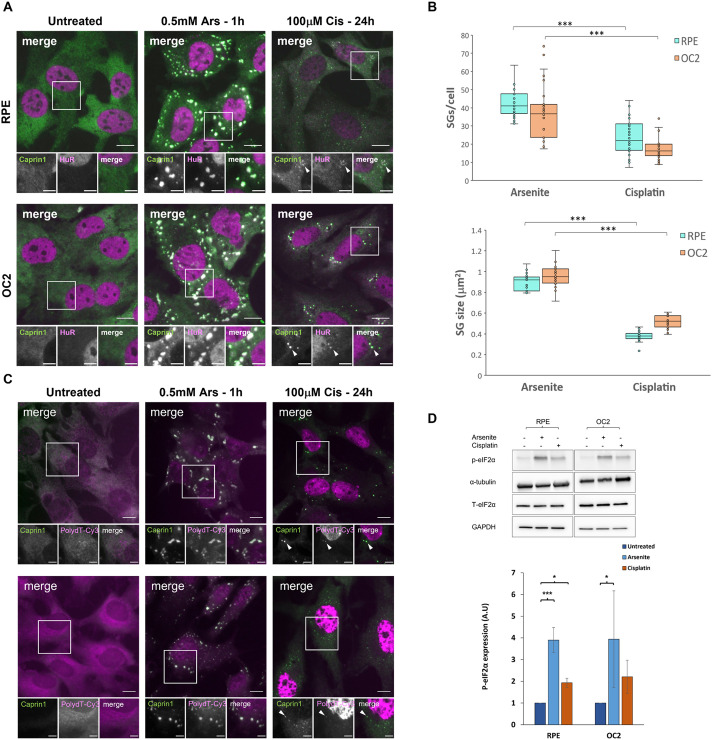
Cisplatin induces fewer and smaller SGs than sodium arsenite. (A) RPE and OC2 cells were treated with 0.5 mM sodium arsenite for 1 h or 100 µM cisplatin for 24 h before fixation and immunostaining for the SG markers Caprin1 (green) and HuR (magenta). White arrowheads indicate SGs. Scale bars: 10 µm (main images), 5 µm (smaller images). (B) Quantification of number and size of SGs induced by arsenite and cisplatin treatment. The box represents the 25–75th percentiles, and the median is indicated. The whiskers show the minimum and maximum data values, excluding outliers calculated according to Tukey's method. Result from a minimum of 100 cells (n=3, nine coverslips assessed, three from each experiment). ***P<0.001 (unpaired two-tailed Student’s t-test). (C) RNA-ImmunoFISH in RPE and OC2 cells with SG marker Caprin1 (green) and polydT-Cy3 (magenta). White arrowheads indicate SGs. Images representative of three experimental repeats. Scale bars: 10 µm (main images), 5 µm (smaller images). (D) Western blot showing the effect of cisplatin on eIF2α phosphorylation and total levels of eIF2α (T-eIF2α), and densitometry of western blot bands for RPE and OC2 cells. Error bars represent s.d. (n=3). *P<0.05, ***P<0.001 (unpaired two-tailed Student’s t-test). A.U., arbitrary units.

