Fig. 2.
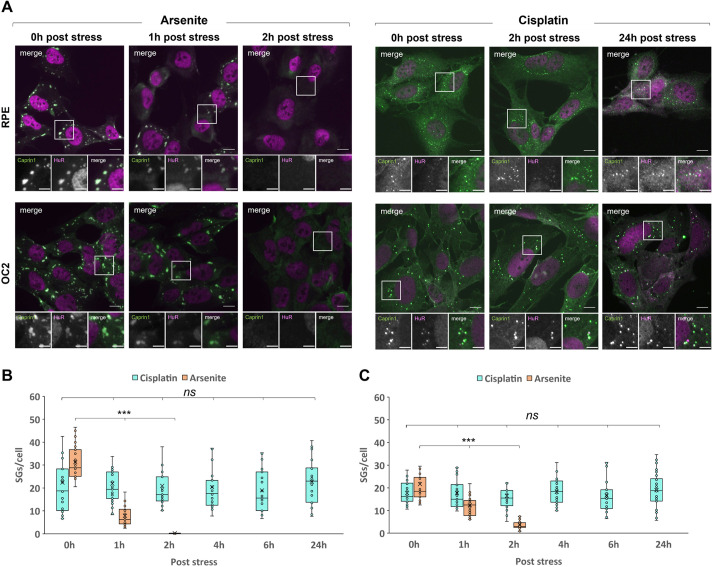
Cisplatin-induced SGs are persistent. (A) RPE and OC2 cells were treated with 0.5 mM sodium arsenite for 1 h or 100 µM cisplatin for 24 h. Medium was removed, and cells washed before fresh medium was added and cells were allowed to recover. Cells were fixed after the indicated recovery times and stained for the SG markers Caprin1 (green) and HuR (magenta). Scale bars: 10 µm (main images), 5 µm (smaller images). (B,C) Graphs show quantification of SGs per cell for RPE (B) and OC2 (C) cells immediately after stress and up to 24 h recovery. The box represents the 25–75th percentiles, and the median is indicated. The whiskers show the minimum and maximum data values, excluding outliers calculated according to Tukey's method. n=3. ***P<0.001; ns, not significant (one-way ANOVA with Tukey’s multiple comparisons).

