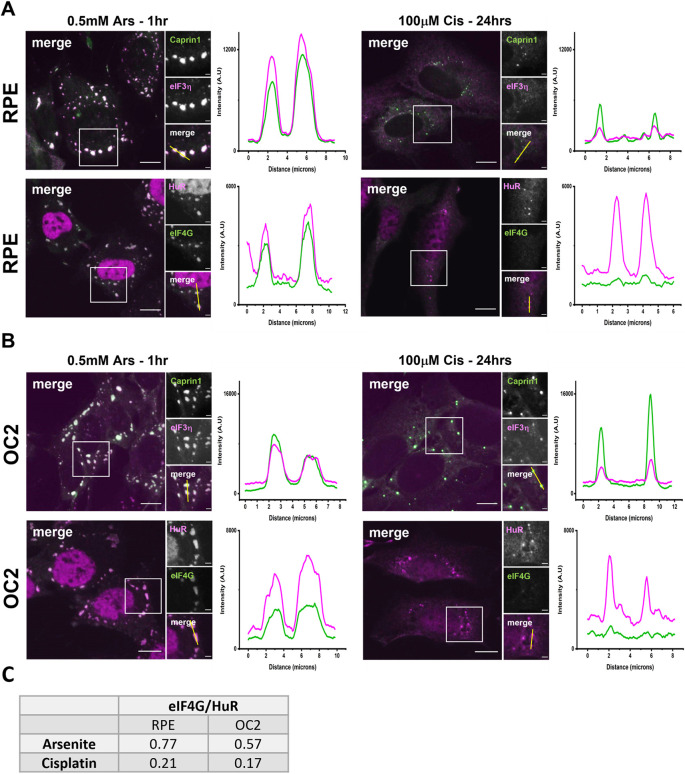
Fig. 4.
Cisplatin-induced SGs contain eIF3η but have a marked reduction in sequestration of eIF4G. (A) RPE and (B) OC2 cells were treated with 0.5 mM sodium arsenite for 1 h or 100 µM cisplatin for 24 h before fixation. They were then immunostained for Caprin1 (green) and eIF3η (magenta), or HuR (magenta) and eIF4G (green). Fluorescence intensity line plots showing the signal intensity along the corresponding yellow line (in small merge panel) indicate the changes in relative sequestration of canonical SG proteins. Scale bars: 10 µm (main images), 5 µm (smaller images). (C) Quantification of eIF4G sequestration to RPE and OC2 cells in response to arsenite and cisplatin. A line was drawn through five SGs per image and the fluorescence intensity along the line was measured. Using Origin™ 2021 software, the area under the peaks was measured, giving the ratio of eIF4G to HuR. SGs quantified=135, n=3 experiments.

