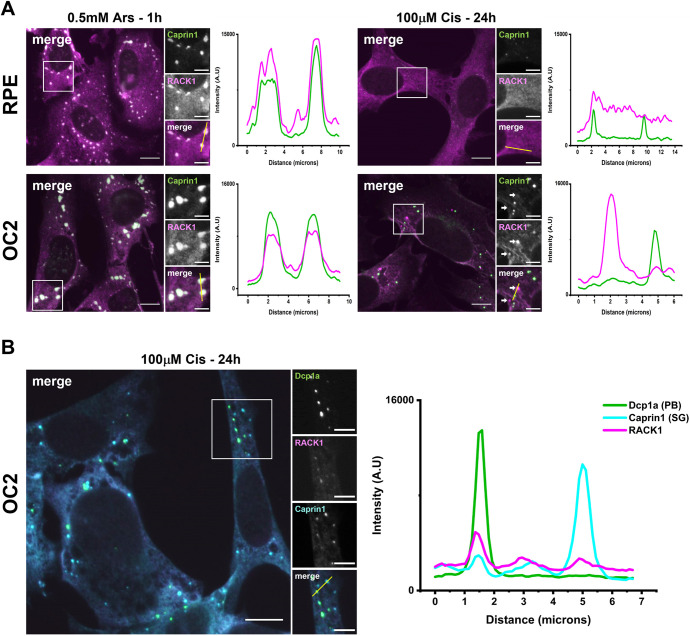
Fig. 6.
Cisplatin-induced SGs have reduced RACK1 sequestration and in OC2 cells RACK1 is localised to PBs. (A) RPE and OC2 cells were treated with either 0.5 mM sodium arsenite for 1 h or 100 µM cisplatin for 24 h before fixation. Cells were then stained for Caprin1 (green) and RACK1 (magenta). (B) Cisplatin treated OC2 cells were then stained for the PB marker Dcp1a (green), RACK1 (magenta) and Caprin1 (cyan). Fluorescence intensity line plots show the signal intensity along the corresponding yellow line (in small merge panel). Images representative of n=3. Scale bars: 10 µm (main images), 5 µm (smaller images). A.U., arbitrary units.

