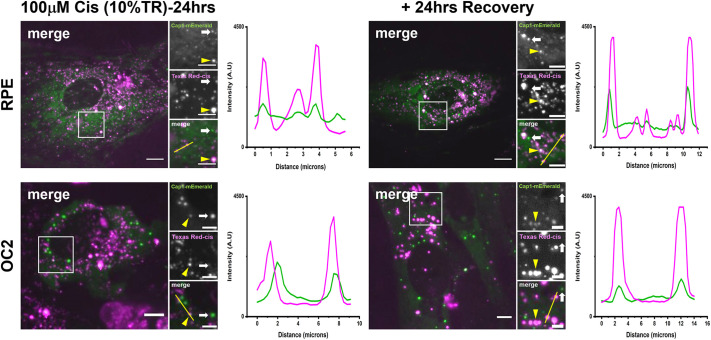
Fig. 7.
Live-cell imaging reveals cisplatin–TR is localised to SG and is retained 24 h post stress. RPE and OC2 cells stably expressing Caprin1–mEmerald were treated with 100 µM cisplatin, 10% of which was cisplatin–TR for 24 h. After 24 h, the medium was changed, and cells were imaged on a spinning disc confocal. Cells were then allowed to recover for 24 h before being imaged again. Yellow arrowheads in all images indicate colocalization of Caprin1 and cisplatin–TR. White arrows indicate Caprin1 puncta that are not localised with cisplatin–TR. Fluorescence intensity line plots show the signal intensity along the corresponding yellow line (in small merge panel). Images representative of n=3. Scale bars: 10 µm (main images), 5 µm (smaller images). A.U., arbitrary units.

