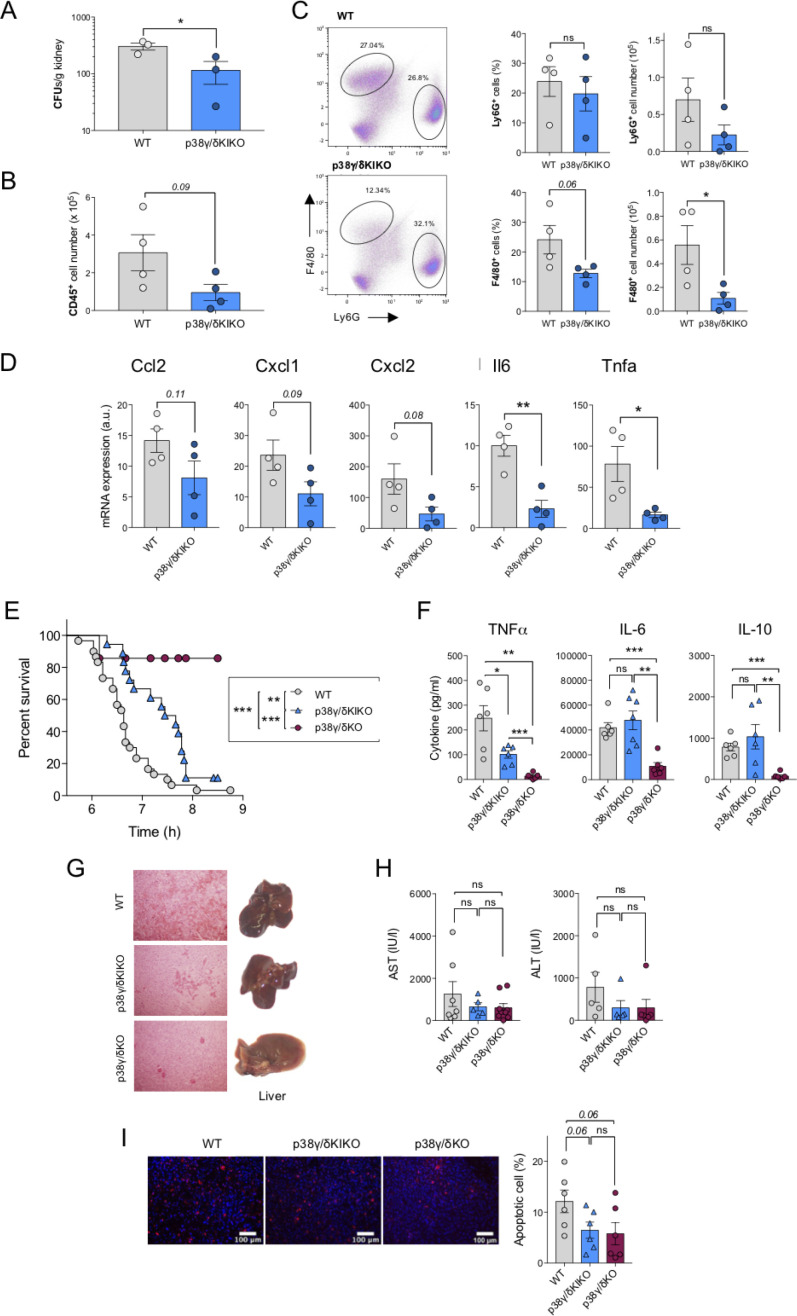
Figure 2. Reduced inflammation in p38γ/δ KIKO mice in response to septic shock.
(A) Wild-type (WT) and p38γ/δKIKO mice were intravenously injected with 1 × 10⁵ CFU of C. albicans. Kidney fungal load was determined 3 days after infection. Each symbol represents an individual mouse. Figure shows mean ± standard error of the mean (SEM), ns not significant; *p ≤ 0.05, relative to WT kidney cells. Kidney cells were stained with (B) anti-CD45, (C) anti -Ly6G and -F4/80 antibodies and positive cells analysed by flow cytometry. CD45+ cells were gated and -F4/80+ and -Ly6G+ cells analysed by flow cytometry. Representative profiles are shown. Each symbol represents an individual mouse. Histograms shows mean ± SEM, ns not significant; *p ≤ 0.05, relative to WT kidney cells. (D) Mice were treated as in (A) and the mRNA levels of indicated genes in the kidney were measured by quantitative PCR (qPCR) 3 days after infection. Each symbol represents an individual mouse. Figure shows mean ± SEM (n = 4 mice/condition). ns, not significant, *p ≤ 0.05, **p ≤ 0.01. (E) WT (n = 31), p38γ/δKO (n = 18), and p38γ/δKIKO (n = 19) mice were injected with lipopolysaccharide (LPS) (50 μg/kg) and D-Gal (1 g/kg), and survival was monitored for up to 9 hr. Graph shows % survival at the indicated times. **p ≤0.01, ***p ≤ 0.001. (F) Serum from mice (E) was collected 2 hr after LPS/D-Gal injection, and TNFα, IL-6, and IL10 were measured in a Luminex cytokine assay. Each symbol represents an individual mouse. Figure shows mean ± SEM (n = 6–7 mice). ns, not significant; *p ≤ 0.05, **p ≤ 0.01, ***p ≤ 0.001. (G) Livers were collected 6 hr after LPS/D-Gal injection. Panels show haematoxylin and eosin (H&E) stained liver sections (left) and whole livers (right). (H) Serum ALT (alanine transaminase) and AST (aspartate aminotransferase) activity at 6 hr after LPS/D-Gal injection. Each symbol represents an individual mouse. Figure shows mean ± SEM (n = 5–7 mice). ns, not significant. (I) Apoptotic TUNEL positive (red) and total nuclei (Hoechst stained-blue) cells were counted using ImageJ programme and the percentage of apoptotic cells calculated. 25 sections per mouse were scored. Representative TUNEL stained liver sections are shown, and figure shows mean ± SEM (n = 6 mice). ns, not significant. Each symbol represents an individual mouse.


