. 2023 Jun 30;12:e84322. doi: 10.7554/eLife.84322

Figure 3. The requirement for long-range resection in interchromosomal recombination correlates with an increased requirement for the DNA damage checkpoint.

Survival frequency in the plating assay for the intrachromosomal strains (A) and interchromosomal strains (B–D) with the indicated genotypes. Intrachromosomal repair products are categorized as Trp+ or Trp-. Bars represent mean values from at least three plating assays per genotype. Error bars represent standard deviation. Significance values are indicated by: ns- not significant, ** p<0.01, *** p<0.001, **** p<0.0001 based on a two-tailed t-test. (C and D) contain overlapping data with B, so only relevant statistics are shown. Source data are available in Figure 3—source data 1.

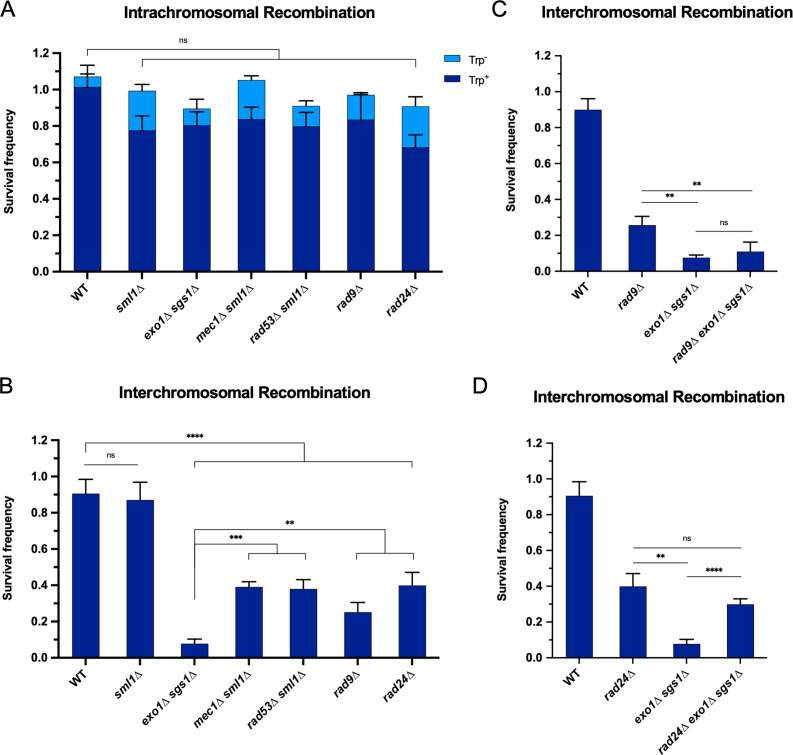
Figure 3—source data 1. This file contains all the source data for Figure 3 and related figure supplements.

Figure 3.

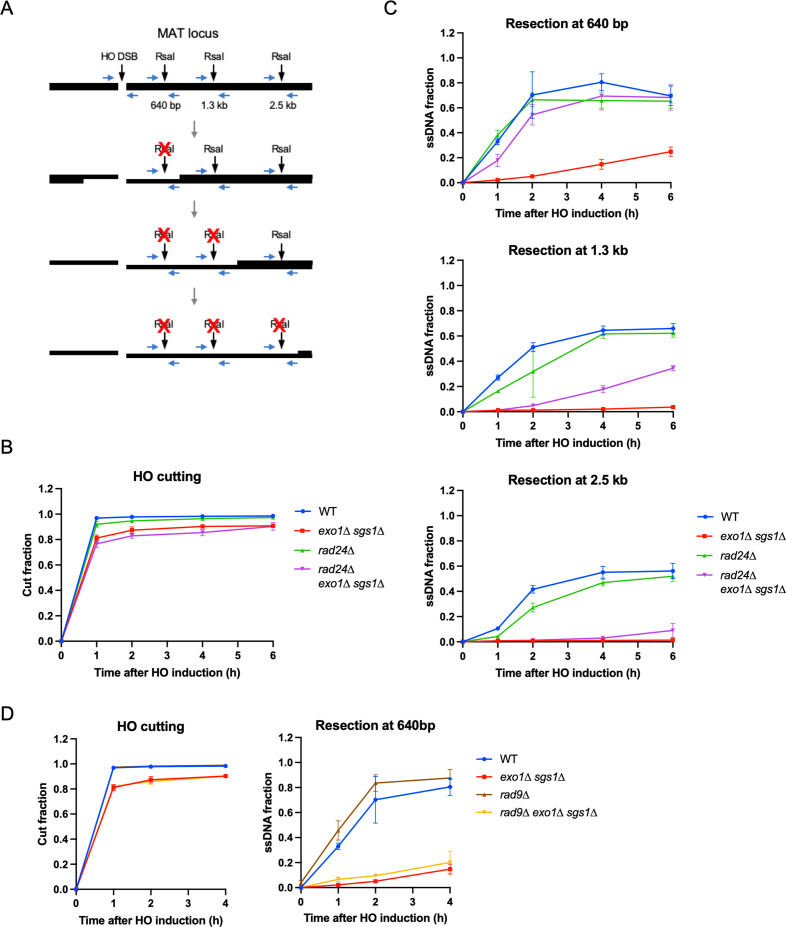
Figure 3—figure supplement 1. Loss of RAD24, but not RAD9 suppresses the resection defect of exo1∆ sgs1∆ cells.

Figure 3—figure supplement 1.

(A) Schematic of the qPCR-based resection assay. The HO cut site, along with three RsaI cut sites used to measure resection are indicated. Oligos are represented as horizontal blue arrows. Resection past an RsaI site leads to its inactivation. (B) HO cutting efficiency as measured by qPCR with primers flanking the HO cut site as shown in (A). (C) Measurement of ssDNA at 640 bp, 1.3 kb and 2.5 kb from the HO DSB using the qPCR-based resection assay. (D) HO cutting efficiency and measurement of ssDNA at 640 bp from the HO DSB as described for B and C. For B-D, each point represents the mean of three biological replicates and error bars represent standard deviation. Source data are available in Figure 3—source data 1.