. 2023 Jun 30;12:e84322. doi: 10.7554/eLife.84322

Figure 4. Restoring the checkpoint can rescue an interchromosomal recombination defect.

(A) Survival frequency in the plating assay for the interchromosomal strains with the indicated genotypes. Bars represent mean values from at least three plating assays per genotype. Error bars represent standard deviation. Significance values are indicated by: ns- not significant, * p<0.05, *** p<0.001, based on a two-tailed t-test. (B) Representative results from the PCR assay in interchromosomal assay strains with and without the Ddc1/Ddc2 co-localization system. The DSB and checkpoint were transiently induced with galactose for 3 hr and cells were collected at the indicated time points. (C) Western blots for Rad53 phosphorylation (top) and corresponding Ponceau S staining (bottom) for strains with and without the Ddc1/Ddc2 co-localization system. The asterisk denotes a non-specific band detected by the HA antibody. (D) Representative result from the PCR assay in G2-arrested cells. WT and exo1∆ sgs1∆ strains containing the interchromosomal assay were arrested with nocodazole for 2 hr prior to transient (3 hr) DSB induction (to). Samples were collected at the indicated time points. For (B) and (D), M refers to 1 kb size ladder (New England BioLabs). Source data are available in Figure 4—source data 1.

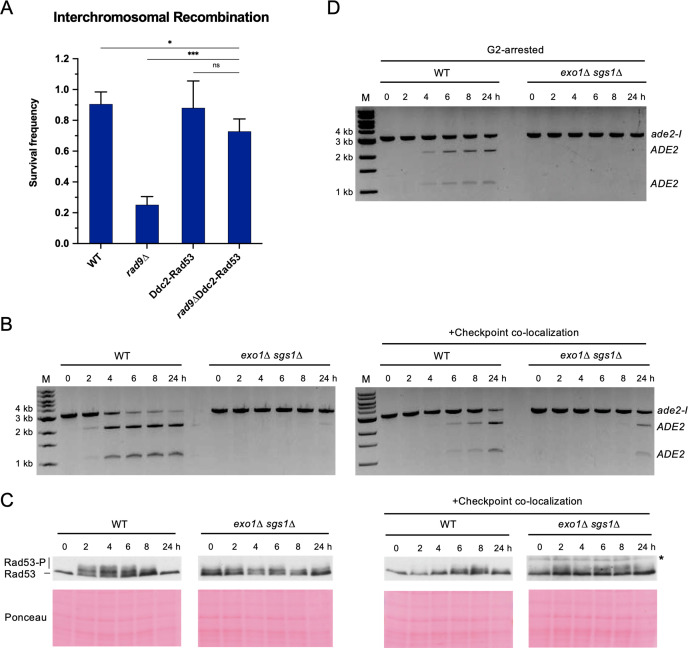
Figure 4—source data 1. This file contains all the source data for Figure 4 and related figure supplements.

Figure 4.

Figure 4—figure supplement 1. Checkpoint restoration in exo1∆ sgs1∆ interchromosomal assay strains.

Figure 4—figure supplement 1.

(A) Survival frequency in the plating assay for the interchromosomal strains with the indicated genotypes. Bars represent mean values from at least two plating assays per strain. Error bars represent standard deviation. Significance values are indicated by: * p<0.05, ** p<0.01, *** p<0.001, **** p<0.0001 based on a two-tailed t-test. (B) HO cutting efficiency as measured by qPCR with primers flanking the HO cut site (top) and measurement of ssDNA at 640 bp from the HO DSB using the qPCR-based resection assay (bottom) as in Figure 3—figure supplement 1. Each point represents the mean of four biological replicates and error bars represent standard deviation. Source data are available in Figure 4—source data 1.
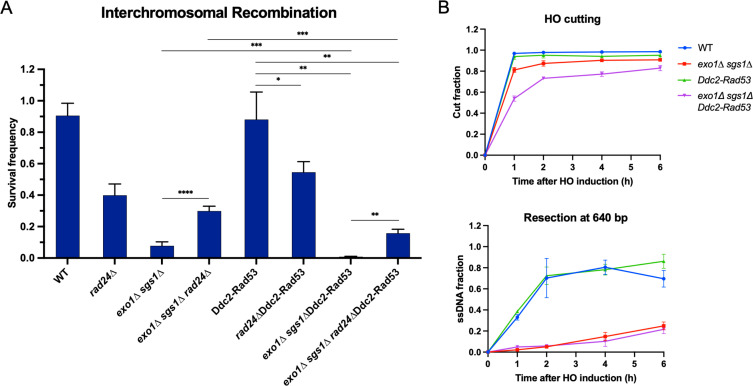
Figure 4—figure supplement 2. Artificial checkpoint restoration in exo1∆ sgs1∆ interchromosomal strains.

Figure 4—figure supplement 2.

(A) Results from the PCR assay in interchromosomal assay strains with the Ddc1/Ddc2 co-localization system. The DSB and checkpoint were transiently induced with galactose for 5 hr and cells were collected at the indicated time points. A positive control for AatII digestion was included for reference. M refers to 1 kb size ladder (New England BioLabs). (B) Western blots for Rad53 phosphorylation (top) and corresponding Ponceau S staining (bottom) for the same timecourse as in A. The asterisk denotes a non-specific band detected by the HA antibody. Source data are available in Figure 4—source data 1.