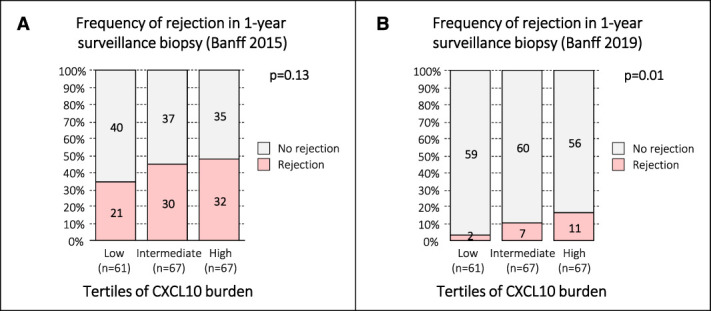
Figure 5.

Correlation of CXCL10 burden with occurrence of rejection in the 1-year surveillance biopsy. Overall, patients had six urine CXCL10 monitoring checkpoints. Those having 5 or 6 measurements were included to calculate the CXCL10 burden (n=227; mean of 5 or 6 measurement). These 227 patients were then divided into three CXCL10 tertiles (low, intermediate, high). Of these 227 patients, 195 had 1-year surveillance biopsies (low [n=61], intermediate [n=67], high [n=67]). (A) Correlation of tertiles of CXCL10 burden with subsequent rejection in 1-year surveillance biopsies using the Banff 2015 classification including borderline changes (Cochran–Armitage trend test P = 0.13). (B) Correlation of tertiles of CXCL10 burden with subsequent rejection in 1-year surveillance biopsies using the Banff 2019 classification including borderline changes (Cochran–Armitage trend test P = 0.01). Figure 5 can be viewed in color online at www.jasn.org.
