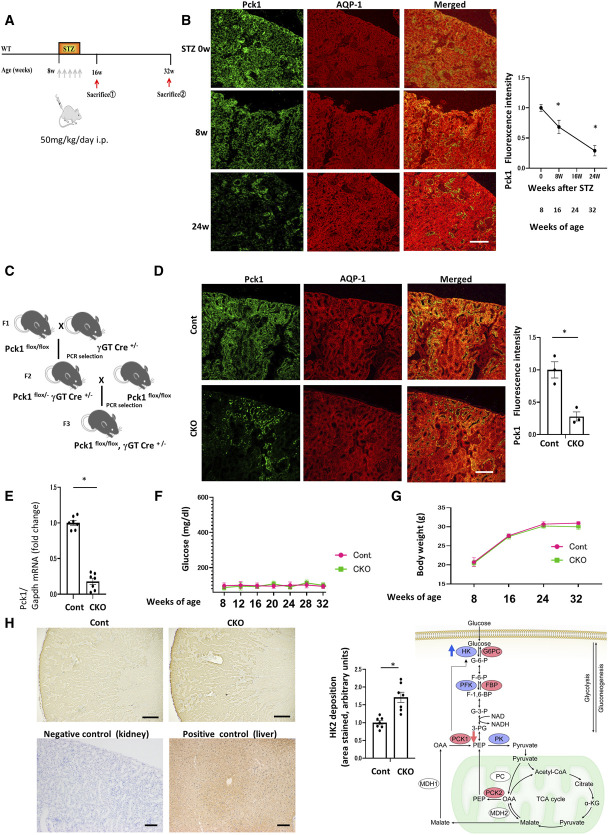
Figure 1.
Effects of Pck1 CKO on urinary albuminuria in DN. (A) A schematic illustration showing the STZ-induced diabetic model procedure. Eight-week-old C57BL/6 mice were stimulated with STZ (50 mg/kg per day×5 d, i.p.) for 5 consecutive days, and Pck1 levels were determined at age 8, 16, and 32 weeks. STZ, streptozotocin; i.p., intraperitoneal injection. (B) Temporary changes in the protein expression of Pck1 in DN. Representative images of kidney cryosections derived from STZ-treated mice were stained by immunofluorescence for Pck1 (green) and costained for AQP1 (red), a proximal tubule marker. Scale bar, 50 μm; N=3. (C) Schematic showing the breeding of Pck1 flox/flox γGT-cre+/− mice. Pck1 flox/flox mice were mated with γGT-cre+/− mice; subsequently, the F2 Pck1 flox/− γGT-cre+/− mice were created. Pck1 flox/flox γGT-cre+/− mice were created by crossing Pck1 flox/− γGT-cre+/− mice with Pck1 flox/flox mice. (D) Pck1 immunofluorescence intensity levels in CKO and control mice. Kidney tissue specimens derived from CKO or control mice at age 32 weeks were stained using immunofluorescence for Pck1 (green) and AQP1 (red). The right panel illustrates the quantitative analysis of the Pck1 fluorescence intensity. Scale bar, 50 µm; N=3. (E) Real-time quantitative reverse transcription analysis of renal mRNA levels of Pck1 (N=7) in control and CKO mice at age 32 weeks. (F) Temporal changes in the mean plasma glucose concentrations in the mice of each group. We examined the mice at age 8, 12, 16, 20, 24, 28, and 32 weeks, respectively. N=7 mice per group. (G) Body weight changes from age 8 to 32 weeks in control or CKO mice. N=7 mice per group. (H) Representative images of sections immune-stained with HK2 in the kidneys from control and CKO mice at age 32 weeks. Negative and positive controls for Pck1 immunohistochemistry. Kidney tissues were used as negative controls and liver tissues as positive controls. Scale bar, 50 μm. The right panel shows proportional staining areas for HK2. N=7. The right schematic shows the metabolic map indicating Pck1 was downregulated, and HK2 was augmented in CKO mice. Statistically significant differences in each group are represented by horizontal bars. *P < 0.05.

