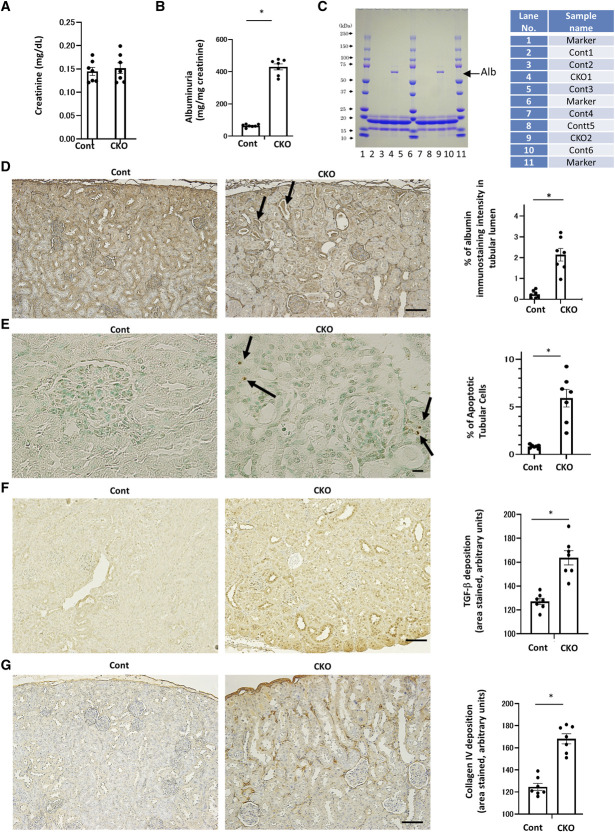
Figure 2.
Renal tubular damage and fibrosis in proximal tubule-specific Pck1 CKO mice. (A) Serum creatinine levels in control and CKO mice at age 32 weeks. N=7 per mice group. (B) Urinary albumin excretion in control and CKO mice at age 32 weeks. N=7 per mice group. (C) SDS-PAGE of mouse urine samples. Urine samples of 32-week-old CKO mice were subjected to a 15% SDS-PAGE before staining with Coomassie blue. N=2 mice per group. (D) Representative images of albumin staining in control and CKO mice. Arrows indicate albumin casts in CKO mice. The right panel depicts the relative staining intensity. N=7 mice per group. (E) Apoptotic tubular cells in control and CKO mice. Arrows indicate apoptotic cells. The bar graph illustrates the quantitative analysis of apoptotic tubular cells. N=7 mice per group. (F) Representative photomicrographs showing TGF-β immunostaining in each group. The bar graph illustrates the quantitative analysis of TGF-β staining. N=7 per mice group. (G) Representative photomicrographs showing collagen IV immunostaining in each group. The bar graph illustrates the quantitative analysis of collagen IV staining. N=7 per mice group. (D, E, F, and G) Light micrograph; scale bar=100 μm. Kidney tissue specimens for immunostaining were obtained from CKO and control mice at age 32 weeks. All data are shown as mean±SEM. Statistically significant differences in each group are represented by horizontal bars. *P < 0.05.

