Figure 5.
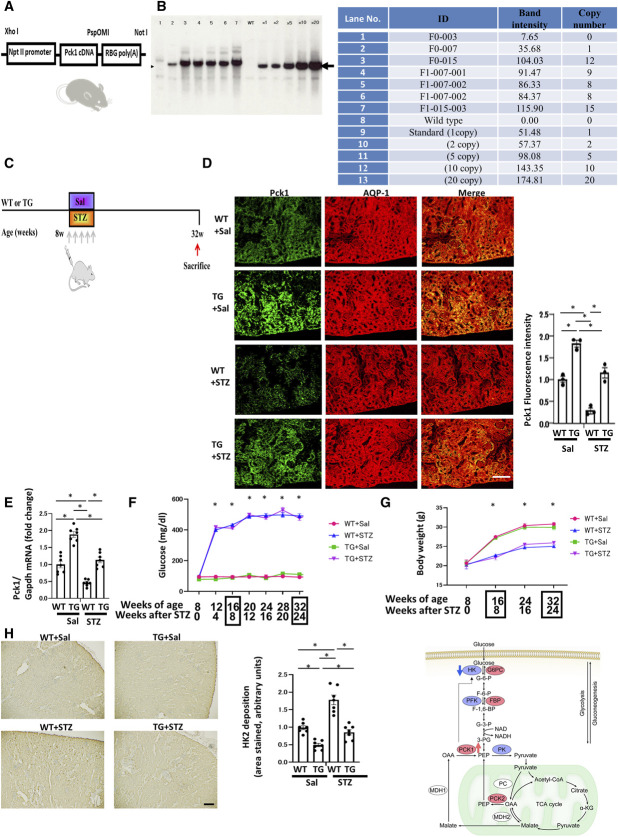
Generation and antialbuminuric phenotypes of TG mice. (A) Constructs used for generating TG mice. A fragment composed of the Npt2 promoter, murine Pck1 cDNA, and RBG poly(A) sequences. (B) Southern blotting shows copies of the Pck1 transgene in mice. Arrows indicate bands corresponding to transgene-derived Pck1. (C) A schematic illustration of the STZ-induced diabetic model procedure. Eight-week-old WT or TG mice were stimulated with STZ (50 mg/kg per day, i.p.) or saline for 5 consecutive days. (D) Representative immunofluorescence images from kidney cryosections derived from each experimental group: WT (wild-type mice)+Sal (saline), WT+STZ, TG+Sal, and TG+STZ mice at age 32 weeks. These sections were stained by immunofluorescence for Pck1 (green) and AQP1 (red). N=3. (E) The real-time PCR reveals the presence of Pck1 in all four groups of mice. N=3. (F) Temporal changes in mean plasma glucose concentrations in mice from each group. We examined the mice 4, 8, 12, 16, 20, 24, and 28 weeks after the treatment, corresponding to age 8, 12, 16, 20, 24, 28, and 32 weeks, respectively. N=7 mice per group. (G) Body weight changes from 0 to 24 weeks after STZ or saline treatment in WT or TG mice. N=7 mice per group. (H) Representative images of sections immune-stained with HK2 in the kidneys from each group of mice at age 32 weeks. Scale bar, 50 μm. The right panel shows the proportional staining areas for HK2. N=7. The right schematic shows the metabolic map where Pck1 was upregulated and HK2 was downregulated in TG mice. All data are shown as mean±SEM. Statistically significant differences in each group are represented by horizontal bars. *P < 0.05.

