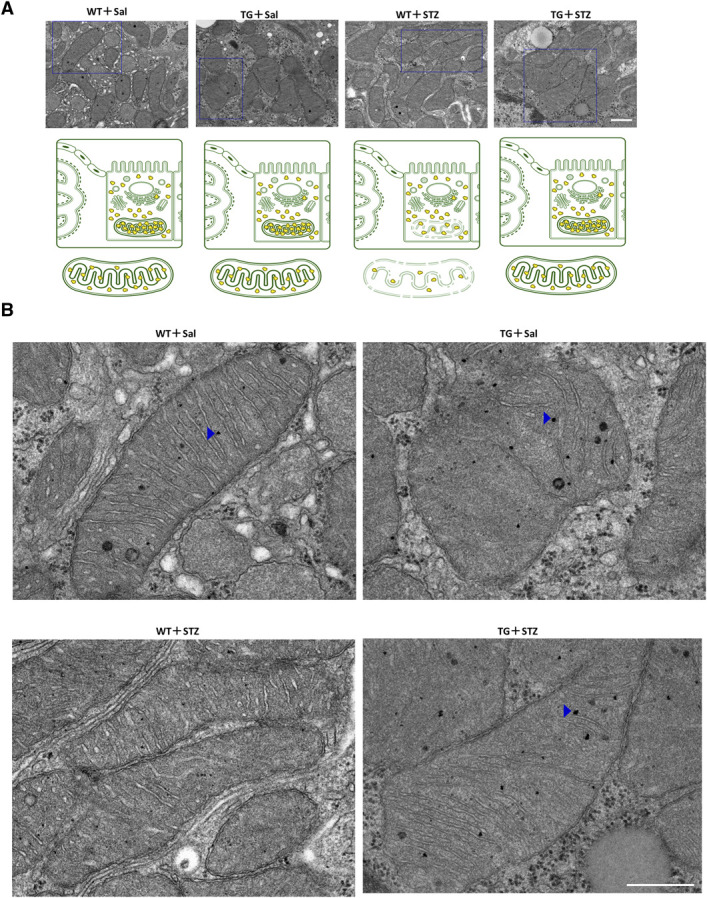
Figure 7.

Mitoribosomal protection in TG mice. (A) Representative electron micrograph in each group. Scale bar=500 nm. Blue squares indicate the enlarged regions. Illustration depicts the mitoribosomes in the four groups of mice. (B) Expanded images of Figure 7A. Blue arrowheads indicate mitoribosomes. Scale bar=500 nm. For EM, the kidney tissue specimens were embedded in Epon epoxy resin. Electron micrographs of ten PTs per kidney were randomly obtained for each mouse to evaluate the morphometry of the PTs.
