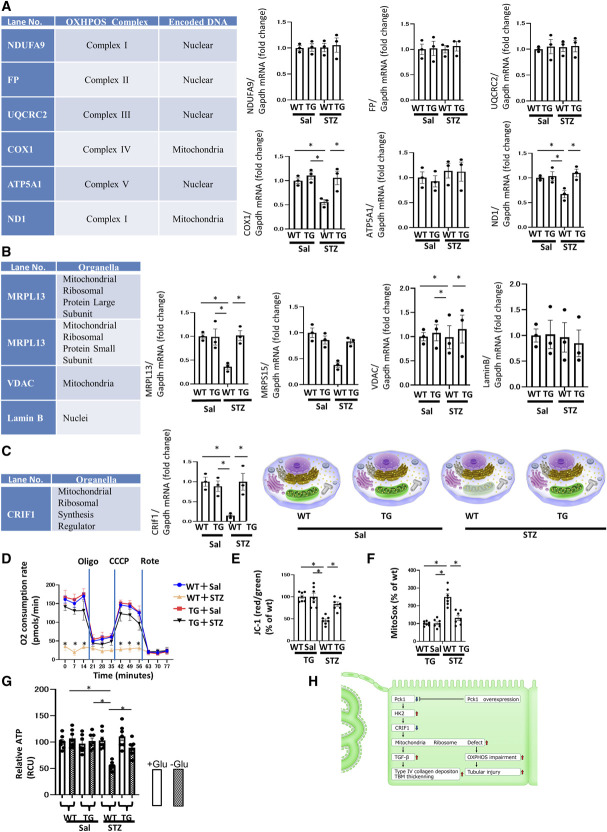
Figure 8.
Mitochondrial protection in TG mice. (A) Real-time quantitative reverse transcription analysis of renal mRNA levels of OXPHOS subunits encoded by nDNA and mtDNA. (B) Real-time quantitative reverse transcription analysis of the renal mRNA levels of intracellular organelle markers. MRPL13 and MRPS15 are mitoribosomal proteins, whereas VDAC is a mitochondrial protein, and Lamin B is a nuclear protein. (C) The real-time quantitative reverse transcription analysis of renal mRNA levels of CRIF1, a mitochondrial ribosomal synthesis regulator. (A–C) Glyceraldehyde 3-phosphate dehydrogenase was used as a control. The kidneys for RT-PCR were obtained from each group of mice at age 32 weeks. N=3 mice per group. Illustration depicting the dysfunctional mitoribosomes and their concomitant mitochondrial dysfunction in WT+STZ mice. These changes in WT+STZ mice were resisted by TG+STZ mice. (D) OCR of TECs isolated from each group of mice was measured using a Seahorse XF-24 flux analyzer. N=3. (E) The ratio of red/green fluorescence of JC-1 of TECs isolated from each group of mice as a measure of the mitochondrial membrane potential. N=6. (F) Fluorescence of MitoSox of TECs isolated from each group of mice as a measure of mitochondrial ROS levels. N=7. (G) ATP content of TECs isolated from each group of mice. N=7. All data are presented as mean±standard errors of the mean. Horizontal bars indicate statistically significant differences between groups. *P < 0.05. (H) Scheme depicting the new mitoribosomes-mediated mechanism of renal profibrotic changes and tubular injury in DN. Under STZ-induced diabetic conditions, the downregulation of Pck1 increased HK2 expression. Increased HK2 expression decreased the expression of CRIF1, causing mitoribosomal defects. The upregulation of mitoribosomal defects leads to deposition of collagen IV in addition to OXPHOS impairment and tubular injury. TG blocked these changes.

