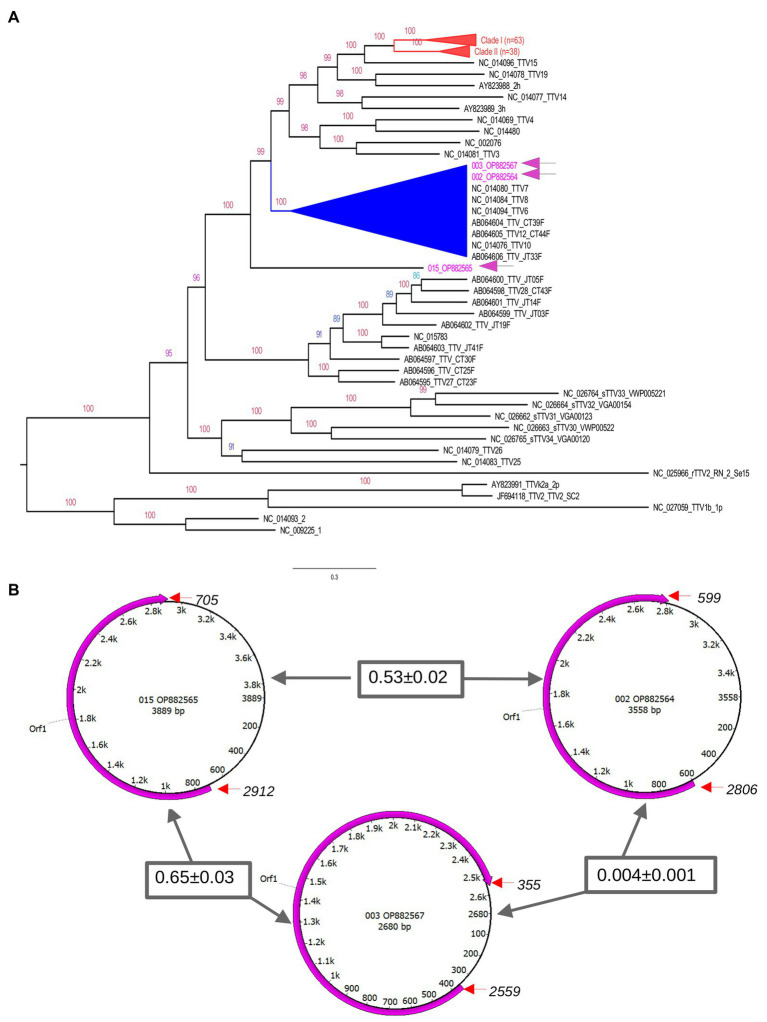
Figure 3.
Genetic features of TTV genomes. The upper panel (A) is the phylogenetic tree inferred using complete genomes of TTV. The tree indicates that there are multiple clades (indicated by distinct colors) composed by TTV identified in different countries. Sequences generated in this study are indicated in blue in the tree. Number at nodes are bootstrap values. Some clusters were collapsed to facilitate visualization (indicated in red). Clades with high bootstrap values are indicated in different colors. All sequences identified in AF from Brazilian patients grouped in a distinct cluster. The exception is the sequence OP882566 located in a unique branch. The lower panel (B) shows the genomic annotation of TTV identified in the current study. Circles represent the single stranded circular genome of TTV. Numbers within these circles indicate the nucleotide position and size. The magenta semi-circular arrows show the position of the predicted ORF1 based on TTV references. The start and end of orf1 are indicated by red arrows. Numbers inside rectangles are the nucleotide divergence of the ORF1 gene region between the TTV sequences.

