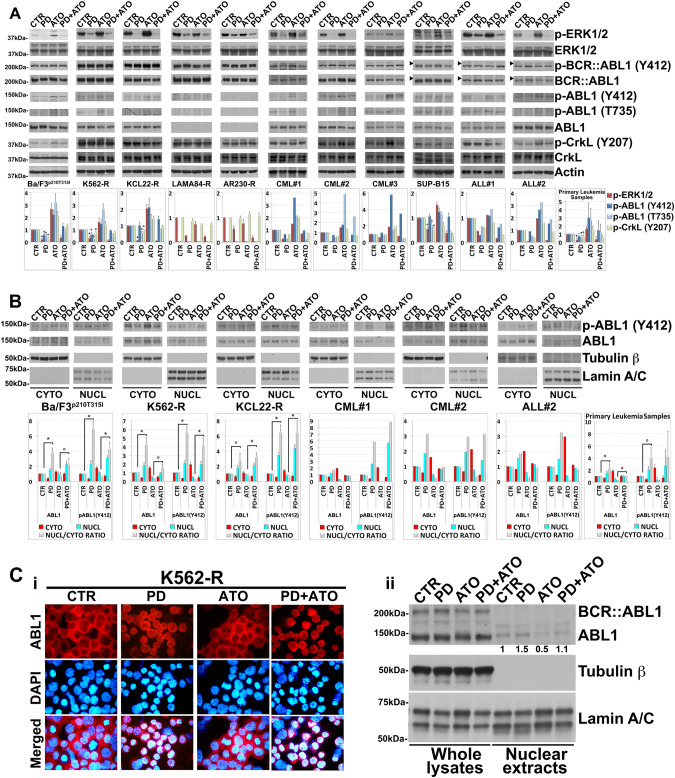
Fig. 2. MEK1/2 impact on the activity and subcellular localization of ABL1 kinase in TKI-resistant Ph+ leukemia.
A Western blot analysis of endogenous phospho-ERK1/2 (Thr202/Tyr204), ERK1/2, phospho-BCR::ABL1 (Tyr412), BCR::ABL1, phospho-ABL1 (Tyr412), phospho-ABL1 (Thr735), ABL1, phospho-CrkL (Tyr207), CrkL and Actin in Ba/F3p210T315I, Imatinib-resistant Ph+ cell lines and primary cells derived from patients with Ph+ leukemia following 24 h of treatment with PD0325901 (0.5 μM) and ATO (2 μM), alone or in combination. The horizontal arrowheads indicate the position of the 200 kDa protein marker for Ph+ ALL cell line and primary blasts from Ph+ ALL patients. Phospho-BCR::ABL1 (Tyr412) and phospho-ABL1 (Tyr412), BCR::ABL1 and ABL1 are from the same blot. Revealed bands were subjected to densitometric scanning and the ratio of each protein to Actin loading control was calculated. Levels of phosphorylated proteins were normalized to total expression levels. The relative fold change of protein levels was normalized with respect to the level of the untreated control, which was taken as 1. The histograms below represent the mean ± SD of four independent experiments on Ph+ cell lines and of n = 5 primary samples (°p < 0.05, *p < 0.01, vs. untreated control, Dunnett’s test). B Immunoblotting for phospho-ABL1 (Tyr412) and ABL1 using Tubulin β and Lamin A/C as loading controls, on cytoplasmic (cyto) and nuclear (nucl) lysates of Ba/F3p210T315I, K562-R, KCL22-R and primary cells from Ph+ leukemia patients that had been sequentially treated with PD0325901 (0.5 μM) and ATO (2 μM) alone or in combination for 24 h. Bands were subjected to densitometric scanning: cytoplasmic and nuclear blots were normalized to total Tubulin β and Lamin A/C respectively. The relative fold change of cytoplasmic or nuclear ABL1 and phospho-ABL1 (Tyr412) level was normalized with respect to control condition, which was taken as 1. The ratio of nuclear to cytoplasmic ABL1 and phospho-ABL1 (Tyr412) protein expression (Nucl/Cyto) is shown. In histogram are shown average quantification results ± SD of three independent blots on Ph+ cell lines and of n = 3 primary samples (°p < 0.05, *p < 0.01, Dunnett’s test). C Immunocytochemistry (i) and Western blot (ii) analysis of K562-R cells treated with PD0325901 (0.5 μM) and/or ATO (2 μM) for 24 h. (i) Immunocytochemistry staining of ABL1 (Red) and DAPI (blue) for nuclear staining. The microphotographs are representative of similar observation in three independent experiments. (ii) Whole-cell lysates and nuclear extracts of PD and/or ATO-treated K562-R immunoblotted for BCR::ABL1, ABL1, Tubulin β and Lamin A/C as loading controls. Bands from nuclear extracts were subjected to densitometric scanning and normalized to Lamin A/C expression. ABL1 protein expression under control conditions was set as 1 for comparison and is shown below the blot.

