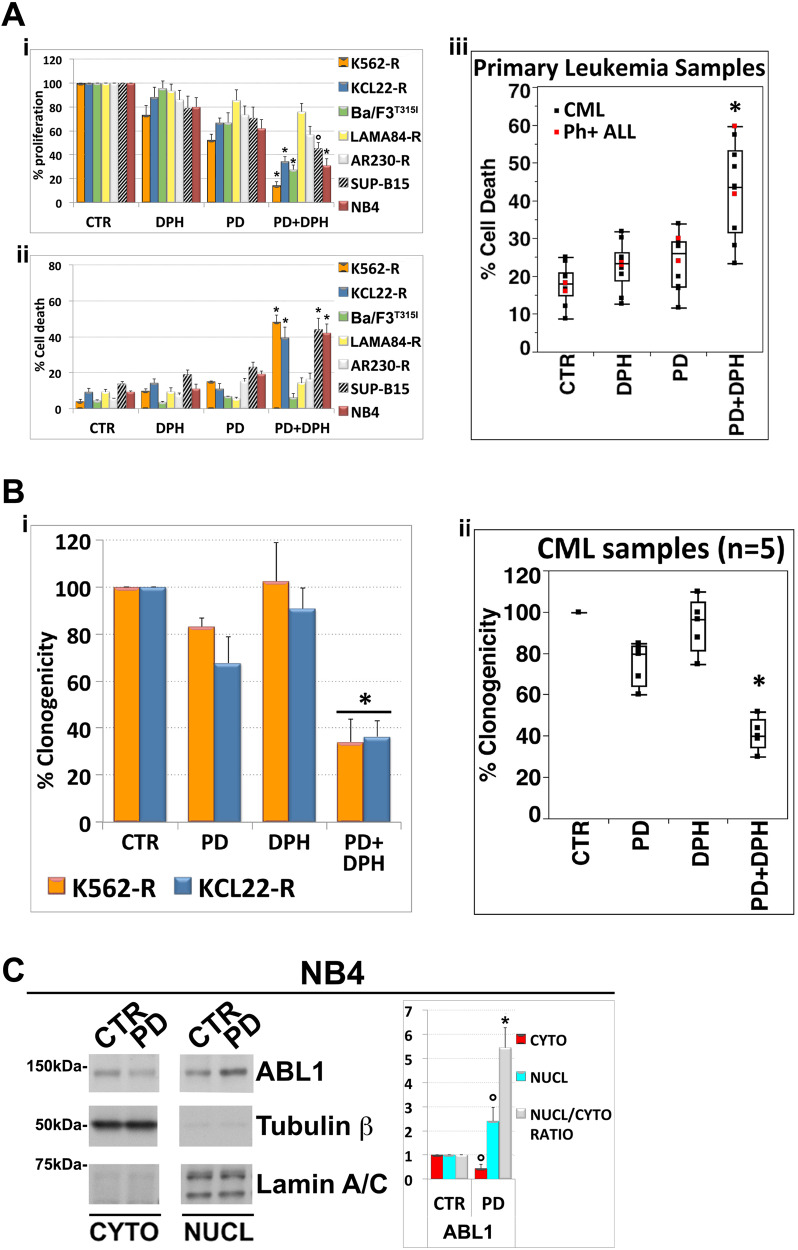
Fig. 3. Activation of native ABL1 kinase enhances the efficacy of MEK1/2 inhibitor PD0325901 in leukemia cells expressing oncogenic ABL1 kinase mutants.
A (i–ii) Imatinib-resistant Ph+ cell lines as well as murine Ba/F3p210T315I were incubated with PD0325901 (0.5 μM) and subsequently with the ABL1 activator DPH (10 μM). After 48 h, cell proliferation was evaluated by counting the total number of viable cells and cell death was measured by Annexin V-FITC/PI labeling. Both cytostatic (i) and cytotoxic (ii) effects of PD/DPH treatment on Ph+ leukemia cells were compared with BCR::ABL1-negative leukemia cell line NB4. Values represent means ± SD of three independent experiments. (°p < 0.005 and *p < 0.001 vs. either treatment alone; Tukey–Kramer tests). (iii) Analogous analyses performed on primary leukemic cells from 7 CML and 2 Ph+ ALL patients treated with PD0325901 (0.5 μM) and DPH (10 μM). After 24 h cell death was measured by Annexin V-FITC/PI staining or sub-G1 DNA content. Median line in box delimited by 25th and 75th percentiles (*p < 0.001 vs. either treatment alone; Dunnett test). B K562-R and KCL22-R cells (i) and primary leukemic cells from patients with Ph+ CML (ii) (CML#4, #5, #6, #7, #9) were seeded in semi-solid methylcellulose medium (103 cells/ml) in presence of PD0325901 (0.5 μM), DPH (10 μM) or the combination PD + DPH. Live colonies were detected after 10 days (CML cell lines) or 14 days (primary samples) of culture by MTT (1 mg/ml) staining and counted using ImageJ quantification software. Data are expressed as percent of colony numbers. The results are the means ± SD of three different measurements performed in triplicate (*p < 0.01, Dunnet test). C Immunoblotting for ABL1, Tubulin β and Lamin A/C as loading controls on cytoplasmic (cyto) and nuclear (nucl) lysates of BCR::ABL1-negative leukemia cells NB4 treated with PD0325901 (0.5 μM) for 24 h. The relative fold change of cytoplasmic or nuclear ABL1 was normalized with respect to control condition, which was set as 1. The ratio of nuclear to cytoplasmic ABL1 protein expression (Nucl/Cyto) is shown as average quantifications ± SD of three independent blots (°p < 0.02, *p < 0.001, vs. untreated control cells, Dunnett’s test).

