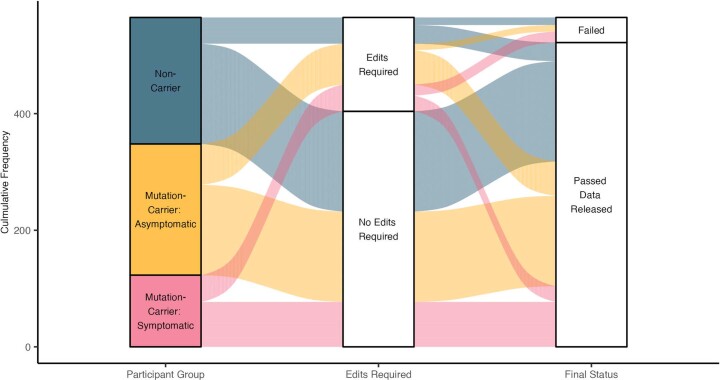
Extended Data Fig. 5. Visual flow chart showing the proportions of T1w images that require editing during the quality control process.
Here we show the relative pass-rate of T1w images undergoing FreeSurfer processing at Washington University. Column one splits the images by impairment and mutation carrying status, while column two shows the relative number of images that pass the initial round of FreeSurfer processing without intervention (72%), and column three indicates the final proportion of images that are able to be included into the DIAN-OBS data release (93%). Between column two and three, technicians of the DIAN-OBS Imaging Core carefully edit images to correct for minor FreeSurfer errors and allow the image to repeat FreeSurfer processing. Importantly, only a small proportion of DIAN-OBS images cannot be recovered through this editing process and will not be included in released data, depicted here as “Failed” (7%). This plot also illustrates that while a larger proportion of symptomatic mutation carriers do require edits, images that are withheld from the final data release represent all three participant groups.

