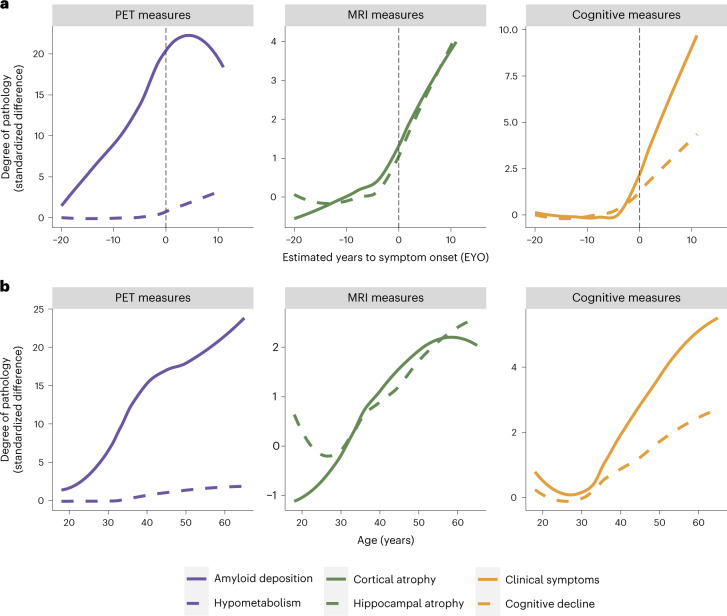
Fig. 4. Visualization of the utility of using the EYO variable in DIAN-OBS analyses.
a, Curves represent levels of baseline biomarkers for mutation carriers (n = 318), relative to non-carrier controls (n = 216). These are plotted against EYO to depict how levels of these markers increase relative to symptom onset (black dashed line), in those who are mutation carriers. Aβ accumulation begins many years before EYO, whereas neurodegenerative pathology occurs much closer to the EYO timepoint. Of note is the onset of clinical and cognitive symptoms that appear right before EYO. In comparison, b aligns these same values by participants’ ages. When assessing the trajectories using age, the relative temporal ordering of these biomarkers is obscured. In the case of ADAD, age is not a good proxy for disease stage. Plot demographics: n = 318, average age = 39.4 years, proportion of females = 56%.

