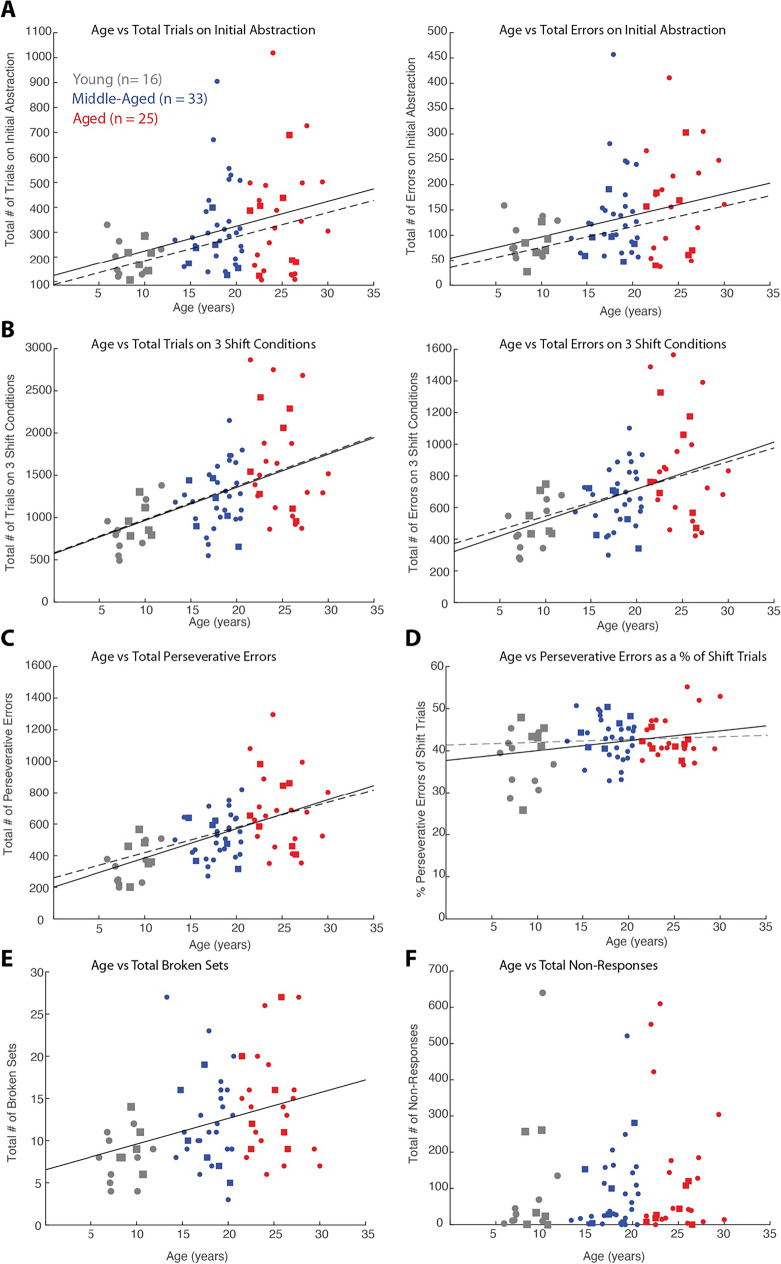
Fig. 3.
Relationship between CSST performance and age. Linear regression lines were computed for all monkeys (n = 74; solid lines) and monkeys with electrophysiological recordings (n = 19; dashed lines and square symbols) showing relationship: A) Total trials and errors in the initial abstraction (red condition) vs. age (trials: p = 0.0031, n = 74; p = 0.067, n = 19; errors: p = 0.0068, n = 74; p = 0.099, n = 19); B) Total trials and errors (in three shift conditions) vs age (trials: p = 1.6 × 10⁻⁵ and 0.027; errors: p = 4.8 × 10⁻⁵ and 0.073); C) Total perseverative errors vs age (p = 6.3 × 10−.7 and 0.025); D) Perseverative errors as a percent of shift trials vs age (p = 0.022 and 0.739); E) Total broken sets vs age (p = 0.0033 and 0.141); F) Number of non-responses vs age (p = 0.46 and 0.496)

