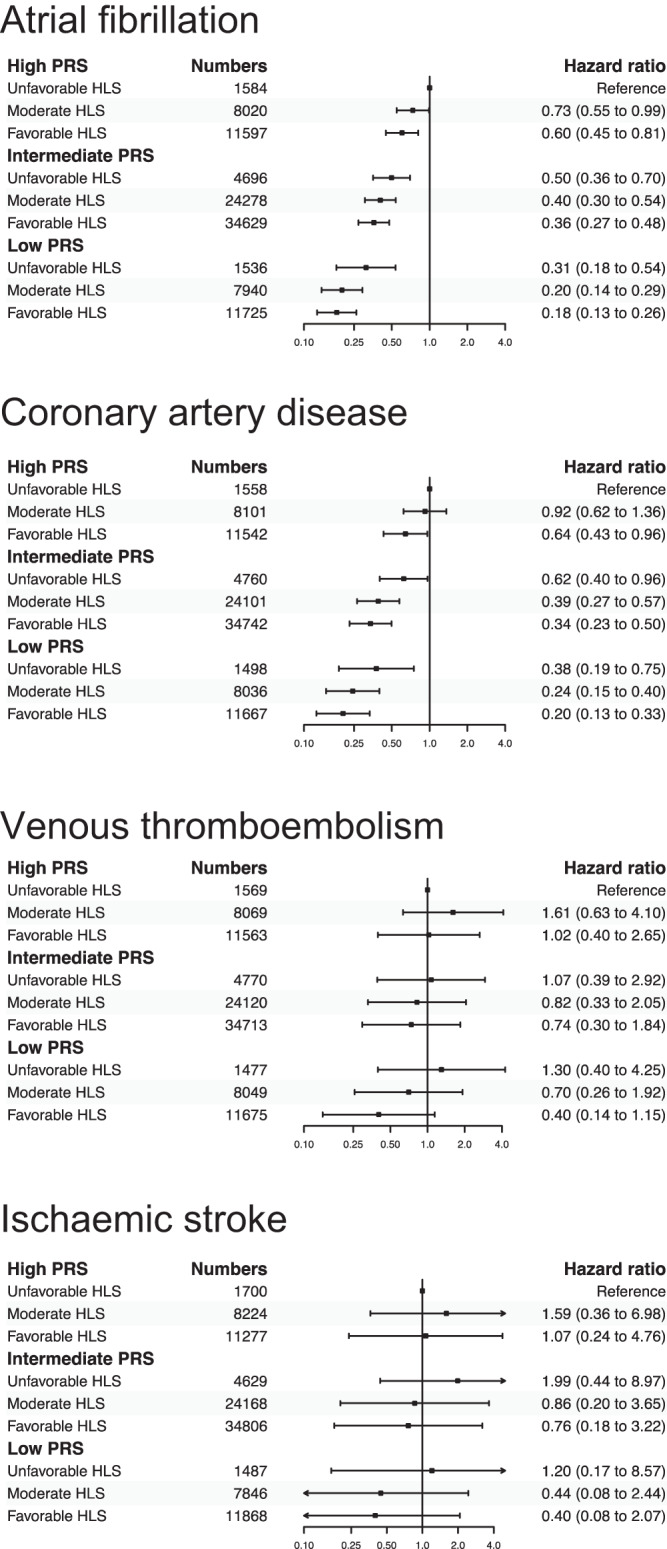
Fig. 3. Joint associations between genetic and lifestyle factors.

The Cox model adjusted for age, sex, education level, index of multiple deprivations, ethnicity, genotyping batch, and the first ten genetic principal components and index variable of the nine genetic and lifestyle subgroups. Each error bar is presented as lower and upper 95% confidence interval and no statistical correction is made for multiple comparisons across subgroups.
