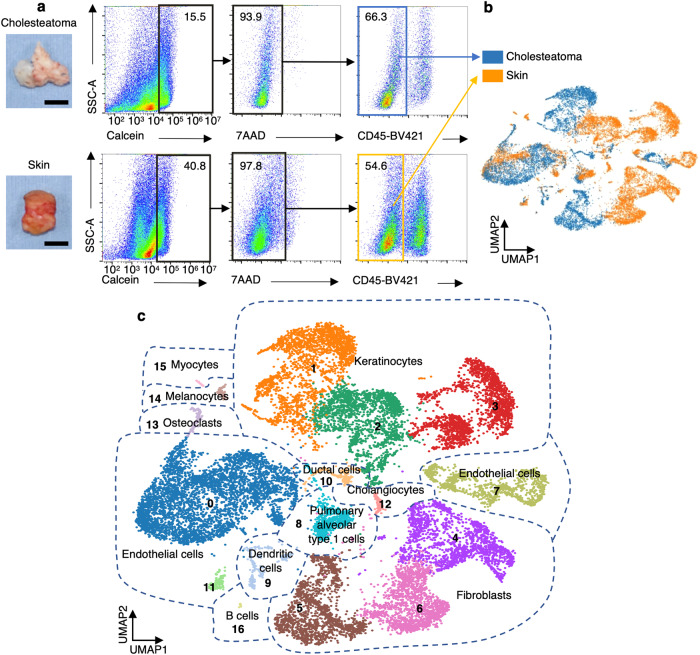
Fig. 1. scRNA-seq analysis of human cholesteatoma and skin specimens.
a Representative gating strategies used in cholesteatoma and skin samples. Live (calcein+ AAD−) CD45− cells. Scale bars: 5 mm. b UMAP plot of scRNA-seq data from 19,273 cells labeled by sample condition. Samples were obtained from three pairs of cholesteatoma and control skin samples labeled according to sample condition. c UMAP plot of scRNA-seq data labeled according to cell type identified in PanglaoDB. The main cell types were keratinocytes, fibroblasts, and endothelial cells.

