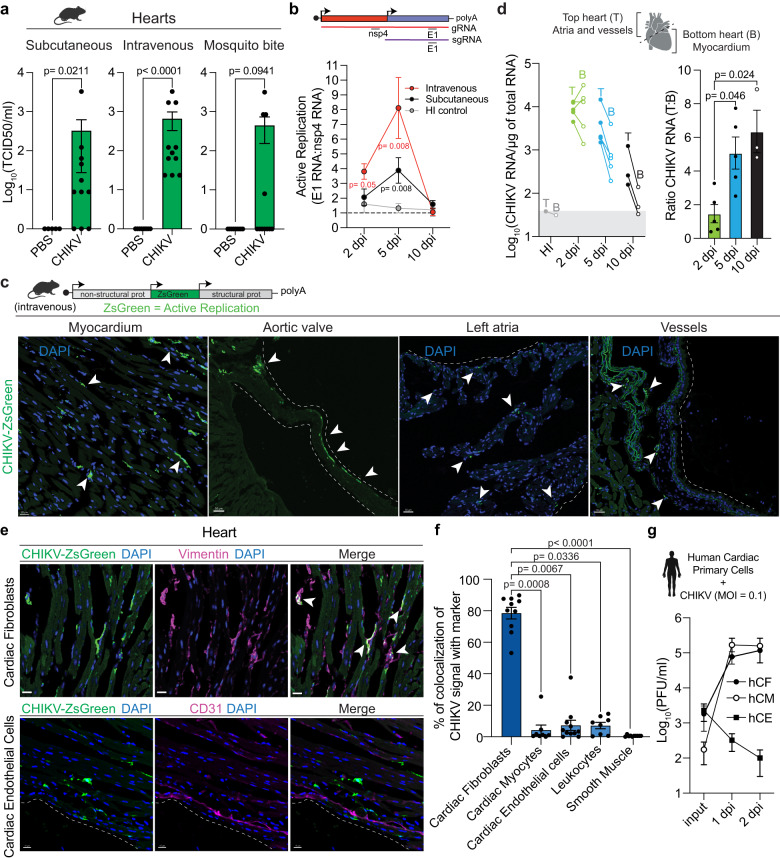
Fig. 1. CHIKV actively replicates in cardiac tissue and targets cardiac fibroblasts.
a Six-week-old C57BL/6 mice were inoculated with 1E5 PFU of CHIKV or mock-infected as specified in each panel. Subcutaneous: CHIKV-infected (n = 11) and mock-infected (n = 5). Intravenous: CHIKV-infected (n = 11) and mock-infected (n = 8). Mosquito bite CHIKV-infected (n = 11) and mock-infected (n = 9). b Ratio of E1 viral RNA to nsp4 viral RNA. Dotted line indicates the E1 RNA:nsp4 RNA ratio (R) of 1. Subcutaneous: 2 dpi (n = 4), 5 dpi (n = 8) and 10 dpi (n = 4). Intravenous: 2 dpi (n = 6), 5 dpi (n = 6) and 10 dpi (n = 4). HI-control: 2 dpi (n = 3), 5 dpi (n = 6) and 10 dpi (n = 4). c Representative images from 2 independent experiments showing infected myocardium (scale= 20 μm) and, aortic valve, left atria, and vessels (scale= 30 μm). White arrows: CHIKV-infected cells. d Mice were infected with 1E5 PFU of CHIKV or HI virus intravenously. Left panel: CHIKV RNA levels for top and bottom hearts. Right panel: ratio of viral RNA levels between top and bottom heart sections. For 2 dpi n = 5, for 5 dpi n = 5, for 10 dpi n = 3. Gray box represents background RNA levels quantified for HI control at 5 dpi (n = 1). e Representative fluorescence microscopy images from 3 independent experiments of ventricular sections of CHIKV-infected hearts stained with different cardiac cell type markers. Scale= 15 μm. f Colocalization analysis between CHIKV-infected cells and different cell type markers. Data are represented as the percentage of the total green signal (infected cells) overlapping with the indicated markers. Colocalization analysis was done in 3-4 independent fields for n = 3 mice. g CHIKV multi-cycle growth curves in human primary cardiac cells. n = 2 independent experiments in technical duplicates. Data are represented as mean ± standard error of the mean (SEM, a, b, d, f, g). p values were calculated using two-tailed Mann-Whitney test (a, b), or Kruskal–Wallis and Dunn’s multiple comparison test (d, f). Created with BioRender.com. Source data are provided as a source data file.

