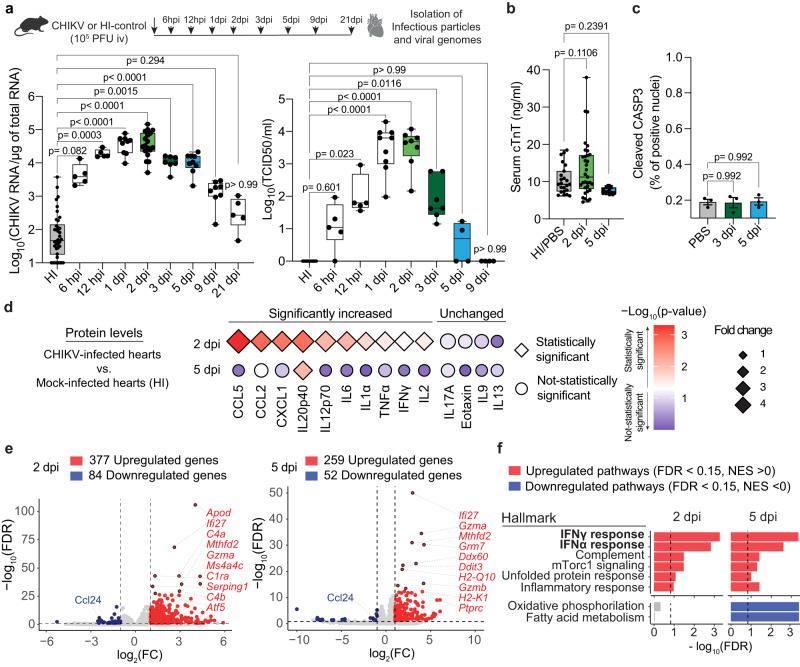
Fig. 2. Cardiac tissue clears CHIKV infection without inducing cardiac damage in immunocompetent mice.
a Upper panel: Schematic representation of the experimental design. Bottom panel: CHIKV viral genomes or CHIKV infectious particles from heart tissue homogenates determined by RT-qPCR or TCID50, respectively. CHIKV viral genomes: HI-control (n = 39), 6 hpi (n = 5), 12 hpi (n = 5), 1 dpi (n = 9), 2 dpi (n = 18), 3 dpi (n = 7), 5 dpi (n = 13), 9 dpi (n = 8) and 21 dpi (n = 8). Infectious particles, HI-control (n = 18), 6 hpi (n = 5), 12 hpi (n = 5), 1 dpi (n = 9), 2 dpi (n = 8), 3 dpi (n = 7), 5 dpi (n = 4), and 9 dpi (n = 4). b Serum levels of cardiac troponin-T measured by ELISA: mock-infected (n = 23), 2 dpi (n = 33), and 5 dpi (n = 14). c Quantifications of cleaved CASP3 nuclei versus total nuclei of stained whole ventricular sections (see ”Methods”). n = 3/group. d Plot showing the relative protein levels of proinflammatory cytokines and chemokines between CHIKV- versus mock-infected heart homogenates at 2 and 5 dpi. Relative expression is represented in log2 fold change (diamond size). Statistical significance is expressed as a color scale (-Log10 adjusted p-value). 2 dpi: HI-control and CHIKV-infected hearts (n = 6/group). 5 dpi: HI-control (n = 4) and CHIKV-infected hearts (n = 5). e Volcano plots from differential expression analysis at 2 dpi (left panel) and 5 dpi (right panel). Red and blue indicate upregulated (FDR < 0.15 and log2(FC) > 1) and downregulated genes (FDR < 0.15 and log2(FC) < −1), respectively. Top-10 differentially expressed genes are indicated. n = 4 mice/group. f GSEA pathway enrichment analysis for Hallmark datasets showing top upregulated and downregulated pathways at 2 dpi and 5 dpi. n = 4 mice/group. Boxplots show median and quartile ranges, whiskers represent the range (a, b). Data is represented as mean ± SEM (c). p values were calculated using Kruskal–Wallis and Dunn’s multiple comparison test (a), and one-way ANOVA with Dunnett’s multiple comparison (b, c). Created with BioRender.com. Source data are provided as a source data file.

