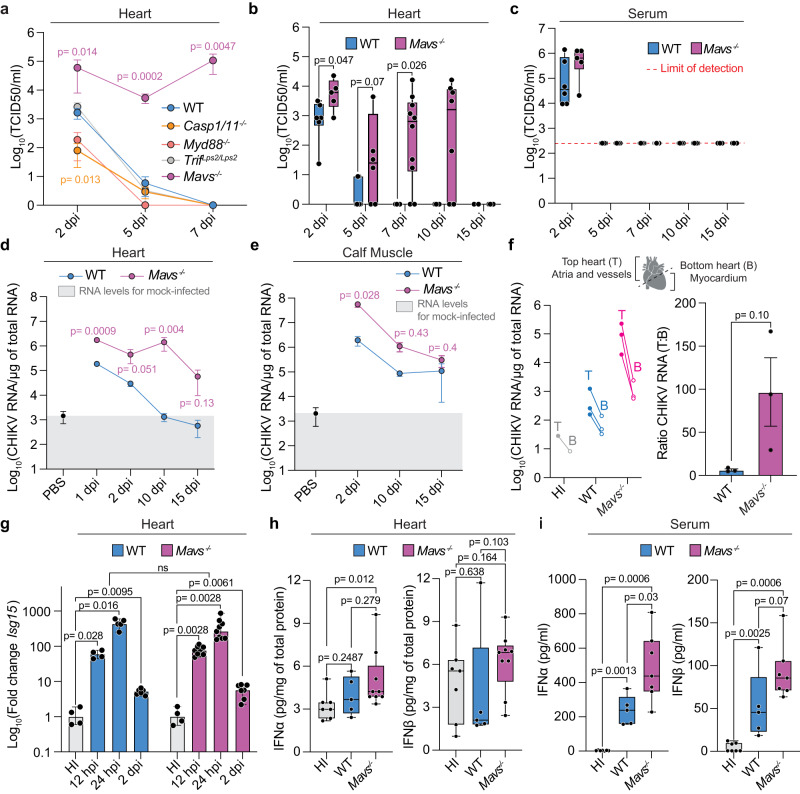
Fig. 4. MAVS signaling is required for clearance in CHIKV-infected hearts.
a Differential susceptibilities to CHIKV-heart infection between MyD88−/−, Trif Lps2/Lps2, Casp1/11−/−, Mavs−/−, and WT mice. WT: 2 dpi (n = 10), 5 dpi (n = 16), and 7 dpi (n = 6). Casp1/11−/−: 2 dpi (n = 5), 5 dpi (n = 8), and 7 dpi (n = 3). MyD88−/−: 2 dpi (n = 4), 5 dpi (n = 6), and 7 dpi (n = 3). Trif Lps2/Lps2: 2 dpi (n = 5), 5 dpi (n = 5), and 7 dpi (n = 4). Mavs−/−: 2 dpi (n = 4), 5 dpi (n = 4), and 7 dpi (n = 4). b, c CHIKV-heart infection kinetics in Mavs−/− and WT mice. b WT: 2 dpi (n = 6), 5 dpi (n = 7), 7 dpi (n = 4), 10 dpi (n = 4), and 15 dpi (n = 2). Mavs−/−: 2 dpi (n = 5), 5 dpi (n = 6), 7 dpi (n = 10), 10 dpi (n = 8), and 15 dpi (n = 4). c. WT: 2 dpi (n = 6), 5 dpi (n = 7), 7 dpi (n = 4), 10 dpi (n = 4), and 15 dpi (n = 2). Mavs−/−: 2 dpi (n = 5), 5 dpi (n = 6), 7 dpi (n = 8), 10 dpi (n = 5), and 15 dpi (n = 4). CHIKV RNA genomes from heart (d) and from calf muscle homogenates (e). d HI-control (n = 6). WT: 1 dpi (n = 5), 2 dpi (n = 6), 10 dpi (n = 4), and 15 dpi (n = 2). Mavs−/−: 1 dpi (n = 9), 2 dpi (n = 5), 10 dpi (n = 8), and 15 dpi (n = 4). e HI-control (n = 3). WT: 2 dpi (n = 4), 10 dpi (n = 5), and 15 dpi (n = 3). Mavs−/−: 2 dpi (n = 4), 10 dpi (n = 8), and 15 dpi (n = 4). f Left panel: CHIKV RNA levels in top and bottom heart sections at 10 dpi. HI-control (n = 1), WT (n = 3), and Mavs−/− (n = 3). Right panel: ratio of viral RNA levels between top and bottom heart sections. N = 3/group. WT dataset at 10 dpi is shared with Fig. 1c. g Isg15 expression levels in Mavs−/− and WT CHIKV-infected hearts. WT: HI-control (n = 4), 12 hpi (n = 4), 24 hpi (n = 5), and 2 dpi (n = 6). Mavs−/−: HI-control (n = 4), 12 hpi (n = 9), 24 hpi (n = 9), and 2 dpi (n = 7). Protein levels of IFN-α and INF-β in heart (h) and serum (i) at 24 hpi. h. HI-control (n = 7), WT (n = 5), and Mavs−/− (n = 9). i. HI-control (n = 7), WT (n = 5), and Mavs−/− (n = 7). Data shown as mean ± SEM (a, d-g). Boxplots show median and quartile ranges, whiskers represent the range (b, c, h, i). P values were calculated using two-tailed Mann-Whitney test (a–i). Created with BioRender.com. Source data are provided as a source data file.

