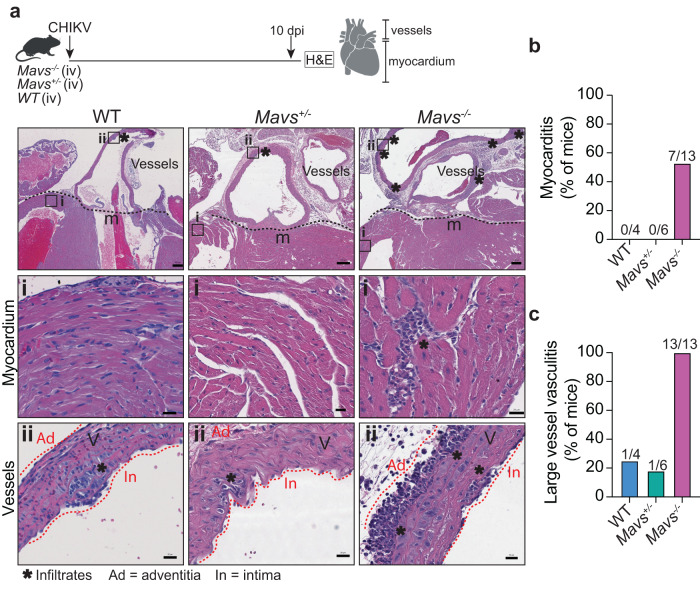
Fig. 5. Mavs−/− mice develop myocarditis and large vessel vasculitis upon CHIKV infection.
a Upper panel: Schematic representation of the experimental design. Bottom panel: Representative H&E from at least four independent mice showing CHIKV-infected WT, Mavs+/− and Mavs−/− hearts at 10 dpi. Scale = 200 μm. The black square indicates the section selected (inset i and ii). Inset i: myocardial region. Inset ii: large vessels attached to the base of the heart. Scale = 20 μm. b Quantification of the number of mice with positive signs of myocarditis. Data represent the percentage of mice with any sign of myocarditis over the total amount of mice analyzed. WT (n = 4), Mavs+/− (n = 6), and Mavs−/− (n = 13). c Quantification of the number of mice with large vessel vasculitis. Data represent the percentage of mice with any sign of vasculitis over the total amount of mice analyzed. WT (n = 4), Mavs+/− (n = 6), and Mavs−/− (n = 13). Created with BioRender.com. Source data are provided as a source data file (Related to Supplementary Data 1).

