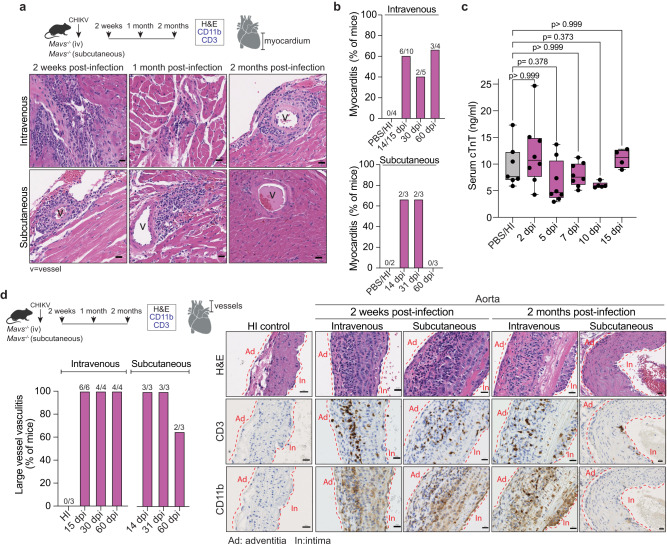
Fig. 6. Chronic inflammation in myocardium and vasculature in CHIKV-infected Mavs−/− mice.
a Upper panel: Schematic representation of the experimental design. Bottom panel: Representative H&E sections from at least three independent mice showing the myocardium of subcutaneous or intravenously inoculated CHIKV-infected Mavs−/− mice at 2 weeks, 1 month, or 2 months post infection. Vessels within the myocardial region are indicated. Scale = 20 μm. b Quantification of the number of mice with positive signs of myocarditis for both intravenous and subcutaneous inoculation routes. Data represent the percentage of mice with any sign of myocarditis over the total amount of mice analyzed. Intravenous: PBS/HI-control (n = 4), 14/15 dpi (n = 10), 30 dpi (n = 5), and 60 dpi (n = 4). Subcutaneous: PBS/HI-control (n = 2), 14 dpi (n = 3), 31 dpi (n = 3), and 60 dpi (n = 3). c. Serum levels of cardiac troponin-T measured by ELISA PBS/HI-control (n = 7), 2 dpi (n = 8), 5 dpi (n = 8), 7 dpi (n = 8), 10 dpi (n = 5), and 15 dpi (n = 4). d. Schematic representation of the experimental design. Left panel: quantification of the number of mice with large vessel vasculitis. Data represent the percentage of mice with any sign of vasculitis over the total amount of mice analyzed. HI-control (n = 3). Intravenous: 15 dpi (n = 6), 30 dpi (n = 4), and 60 dpi (n = 4). Subcutaneous: 14 dpi (n = 3), 31 dpi (n = 3), and 60 dpi (n = 3). Right panel: representative H&E and CD3/CD11b IHC sections from at least three independent mice showing vessels attached to the base of the heart of subcutaneous or intravenously inoculated CHIKV-infected Mavs−/− mice at 2 weeks and 2 months post infection. Scale= 20 μm. Boxplots show median and quartile ranges, whiskers represent the range (c). P values were calculated using Kruskal–Wallis with Dunn’s multiple comparisons test (c). Created with BioRender.com. Source data are provided as a source data file. Related to Supplementary Data 1 and Supplementary Fig 6.

