Figure 7.
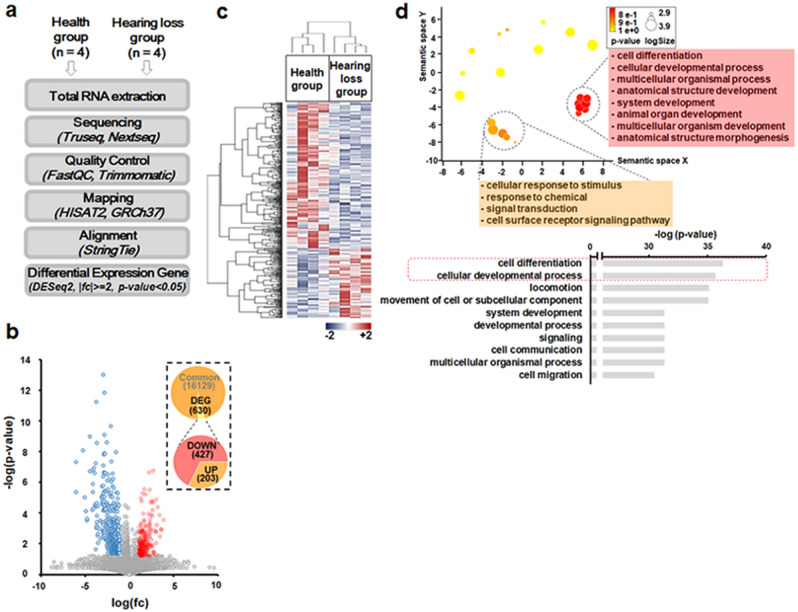
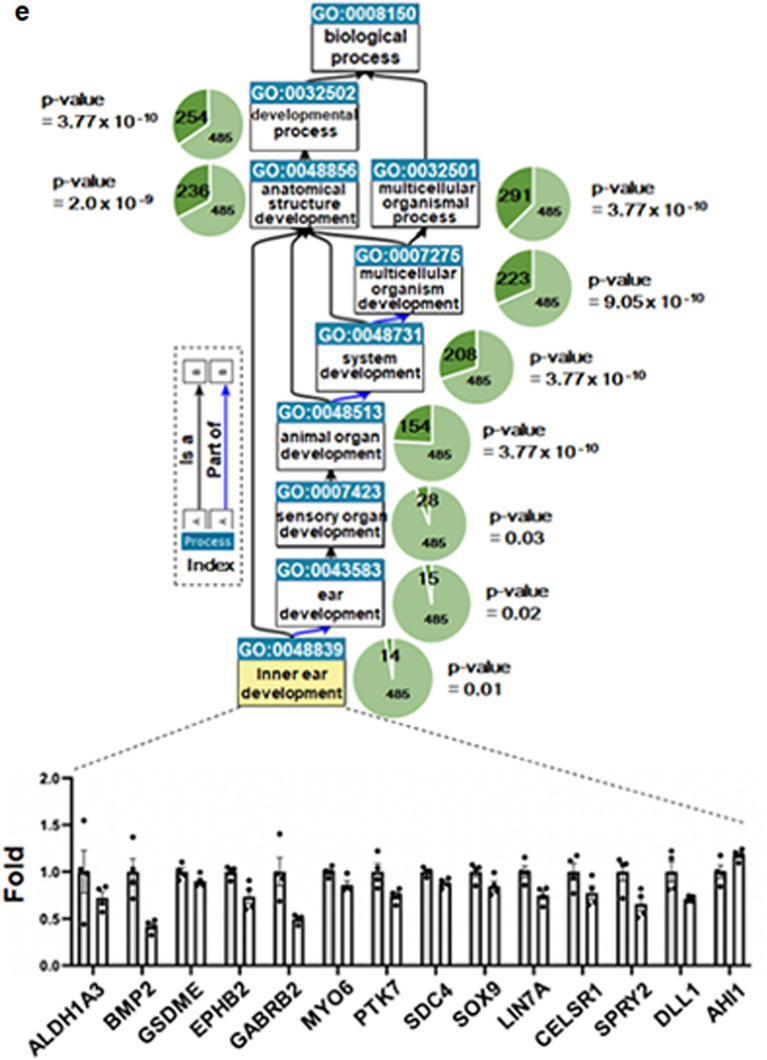
RNA sequencing analysis. (a) Schematic diagram of the analysis flow. (b) Volcano plot of significantly different genes (n = 630). Upregulation (red dot) and downregulation (blue dot) gene numbers were summarized as a pie graph (inlet). (c) Heatmap analyses of differential gene expression. The higher expression level was shown as red color while the lower expression was shown as blue. (d) (Upper) Revigo visualization of the top 30 gene ontology (GO) data. Clustered terms were listed in each box. (Bottom) Top 10 GO terms in biological process. The red dot box showed top2 GO terms, including cell differentiation and cellular developmental process. (e) Ancestor chart view of the QuickGO. In each GO term, enriched gene number was shown in the dark green pie while term size was shown as green pie with the adjust p value calculated by hypergeometric test and multiple testing correction (FDR). The colored arrow showed the relationship between the Ancestor term and the Child term. The black arrow showed “is a” and the blue arrow showed “part of”, which is explained in the index box. 14 genes which belong to the GO-term (GO: 0048839) were significantly enriched (adjusted p value = 0.01). 14 transcripts were significantly enriched for the GO term (GO: 0048839) (adjusted p value = 0.01). To verify their dysregulation, each FPKM value of 14 genes from the health group (gray, n = 4) and the hearing loss group (white, n = 4) was compared as fold change with standard error of the means (SEM). *p < 0.05 was the result of a statistical significance test using the Student's t-test (bottom).


