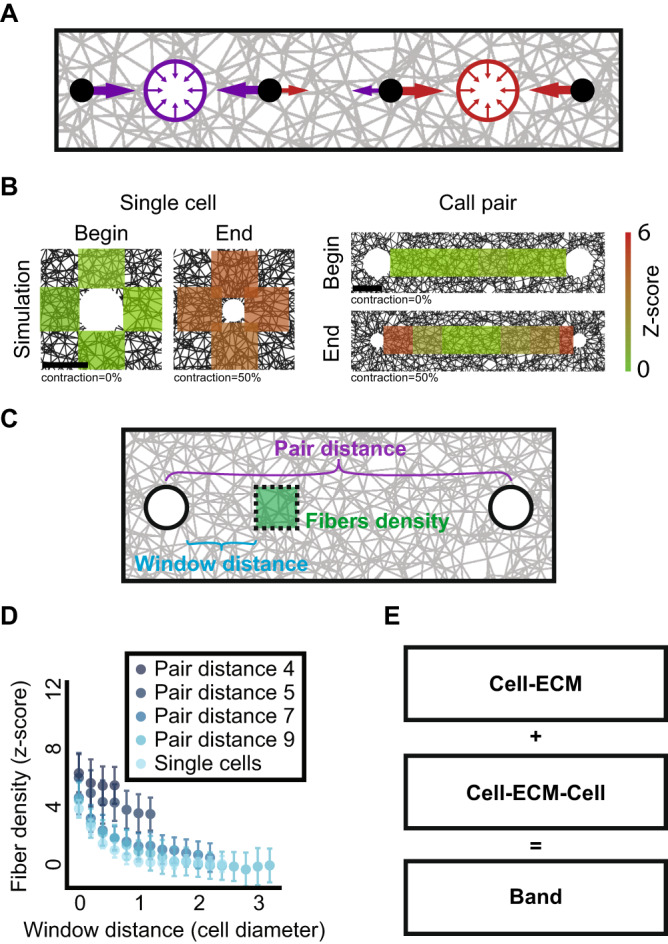
Fig. 1. Quantifying ECM densification in simulated cell-ECM-cell mechanical communication.

A Fibers in between pairs of cells (red and purple circles) are remodeled by the integrated mechanical forces that both cells exert on the ECM. Colored arrows depict the magnitude of the force experienced in a specific location in the fibrous gel that are generated by the two cells. B Quantitative visualization of representative simulated cell-ECM interactions (left) and cell-ECM-cell communication (right) at the onset (“begin”) and after (“end”) 50% cell contraction. Color code encodes the ECM density in z-score, the number of standard deviations above background levels. Scale bar is one cell diameter. C Schematic sketch. Pair distance (purple) between cell pairs at the onset of imaging. Window distance (cyan) is measured from the boundaries of one cell toward the other cell in the pair, along the axis (in 3D) defined by the pair. D Quantifying fiber densification after 50% cell contraction as a function of the distance around simulated single cells (“single cells”) and as a function of the distance between cell pairs (“pair distance”). Single cells (N = 7). Pair distance of 4 (N = 19), 5 (N = 20 pairs), 7 (N = 20 pairs), or 9 (N = 19 pairs) cell diameters. Note that window distance is bounded in lower pair distances. Mean and standard deviation are displayed for each distance. E A dense fibrous “band” between cell pairs is formed by the combined effects of cell-ECM interactions and cell-ECM-cell communication.
