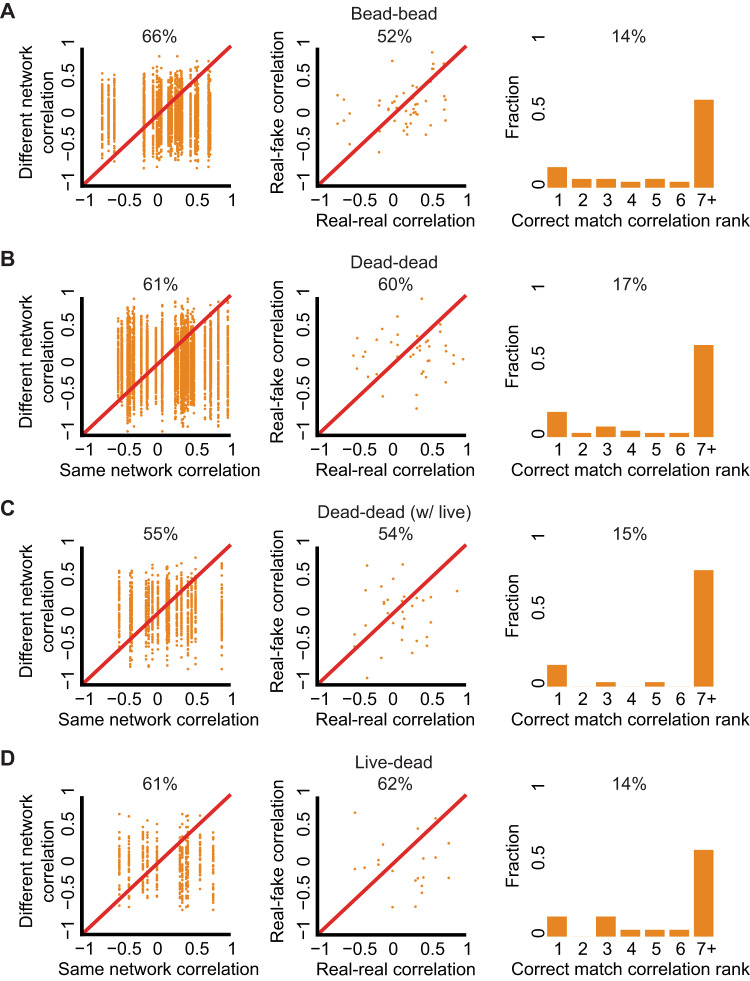
Fig. 6. Experimental negative controls measured with same-versus-different analysis (first column), real-versus-fake analysis (middle column), and match making analysis (right column). All three measurements were significantly reduced in all the negative control experiments.
A–D compared to live fibroblasts (Figs. 4 and 5) and cancer cells (Fig. S9). A Experiments with fluorescent beads. Same-versus-different: N = 25, 66% “same” > “different, p-value < 0.0001. Real-versus-fake: N = 25, 52% “real” > “fake”, p-value not significant. Matchmaking analysis: N = 50, correct matching probability = 14%. B–D Experimental controls with live and dead fibroblast cells. B Dead cells. Same-versus-different: N = 35, 61% “same” > “different, p-value < 0.0001. Real-versus-fake: N = 29, 60% “real” > “fake”, p-value not significant. Matchmaking analysis: N = 70, correct matching probability = 17%. C Dead cells with the presence of live cells. Same-versus-different: N = 17, 55% “same” > “different, p-value < 0.0001. Real-versus-fake: N = 17, 54% “real” > “fake”, p-value not significant. Matchmaking analysis: N = 34, correct matching probability = 15%. D Live and dead cells. Same-versus-different: N = 17, 61% “same” > “different, p-value < 0.0001. Real-versus-fake: N = 11, 62% “real” > “fake”, p-value not significant. Matchmaking analysis: N = 22, correct matching probability = 14%.

