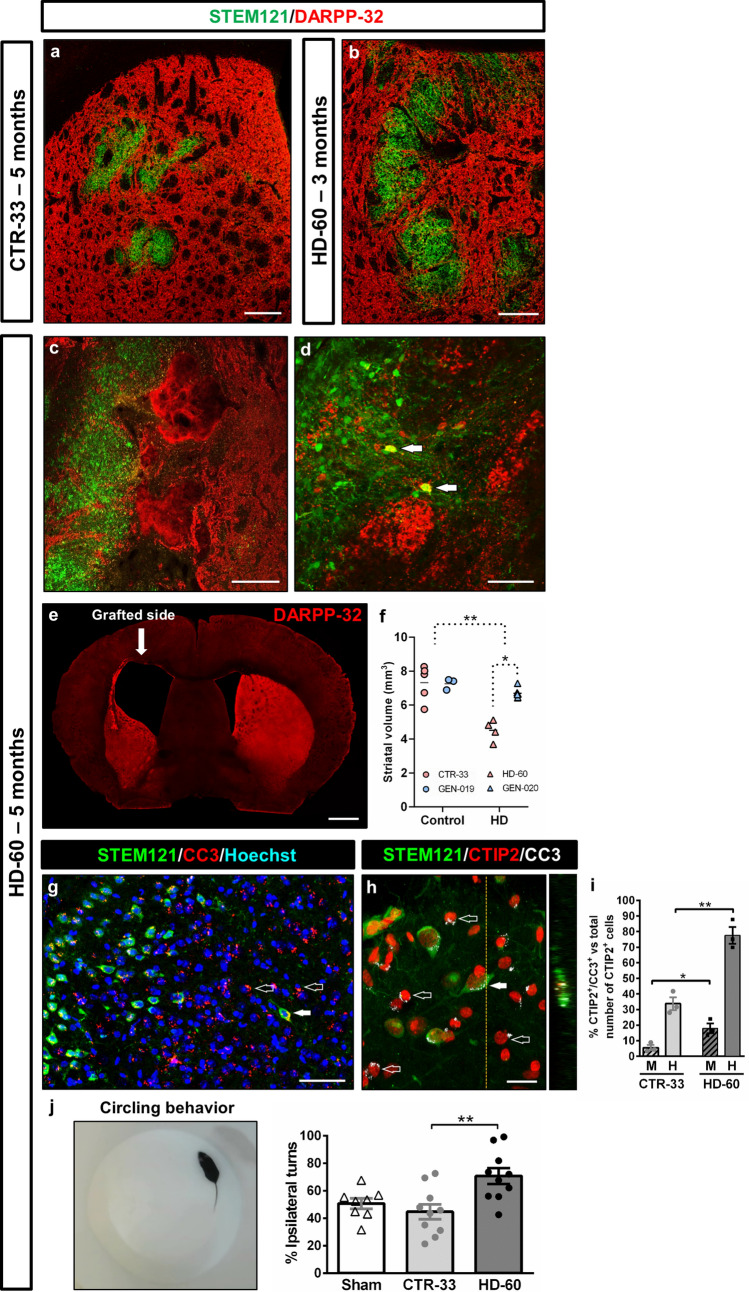
Fig. 3.
Selective cell death of engrafted HD human MSNs and degeneration of the host striatum alters mouse behaviour at 5 months PST. a–d Striatal coronal sections from CTR-33 and HD-60 chimeric brains immuno-labelled for STEM121 (green) and DARPP-32 (red). d Arrows point to DARPP-32+ HD-60 cells surrounded by degenerating mouse striatal tissue. e Low-magnification coronal view of a HD-60 chimeric brain at 5 months PST labelled for DARPP-32, exhibiting a dramatic increase in ventricular volume. f Histogram representing the assessment of striatal volume in CTR and HD chimeric mouse brains at 5 months PST. g, h Striatal coronal sections from HD-60 chimeric brains at 5 months PST immunolabelled for STEM121, CTIP2 and cleaved caspase-3 (CC3). Filled arrows point to apoptotic human striatal neurons and empty arrows point to apoptotic endogenous mouse cells. i Graph showing the percentage of apoptotic striatal neurons amongst mouse (M) and human (H) cells, in both CTR-33 and HD-60 chimeric mice. j Amphetamine-induced circling behavioural test performed with Sham, CTR-33 and HD-60 chimeric mice at 5 months PST. M mouse, H human. Scale bars 20 µm in h; 50 µm in d, g; 200 µm in a–c; 1 mm in e. Data are expressed as mean ± SEM. f n = 8 Control [CTR-33 (n = 5, pink), GEN-019 (n = 3, blue)] and n = 10 HD [HD-60 (n = 4, pink), GEN-020 (n = 6, blue)] mice; Unpaired t-test, two-tailed, P = 0.0093 (Control vs HD), P = 0.0490 (HD-60 vs GEN-020). i n = 3; Unpaired t-test, two-tailed, P = 0.0251 (CTR-33 M vs HD-60 M), P = 0.0029 (CTR-33 H vs HD-60 H). j n = 8 Sham, n = 10 CTR-33 and n = 10 HD-60 mice; One-way ANOVA, Tukey’s multiple comparisons test, P = 0.0035 (CTR-33 vs HD-60)

