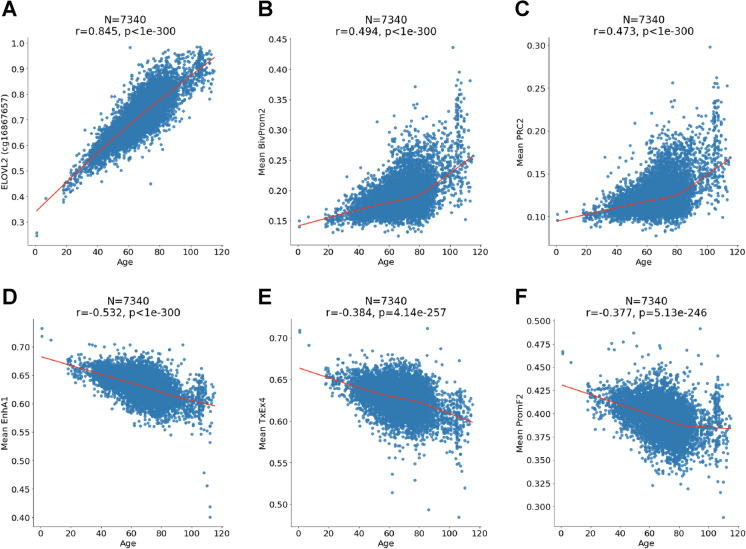
Fig. 5.
Individual CpGs and mean CpG in chromatin states. Chronological age (x-axis) versus A ELOVL2 methylation (y-axis) or mean methylation in B chromatin state BivProm2, C target sites of polycomb repressive complex 2, D chromatin state EnhA1, E chromatin state TxEx4, and F chromatin state PromF2. Each panel reports the sample size (N), Pearson correlation coefficient (r), and the p value (p), and red line is the LOWESS regression smooth curve

