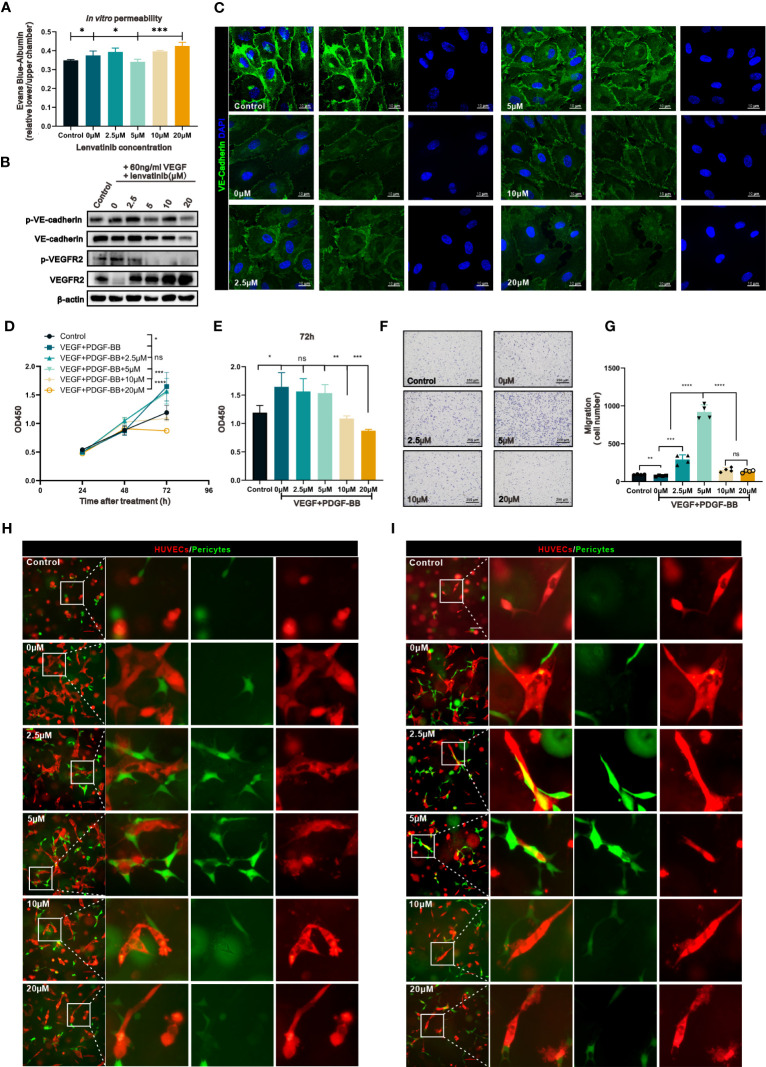
Figure 3.
The concentration-escalation treatment with lenvatinib showed different phenotypes of vascular permeability and interaction with pericytes. (A) The permeability of the endothelial monolayer was assessed by the passage of Evans blue (EB)/albumin through the upper endothelial monolayer in the lower chamber (n=3 separate experiments). (B) Western blot analysis of the phosphorylation of VE-cadherin and VEGFR2 and total expression of VE-cadherin and VEGFR2 in the indicated HUVECs treated with lenvatinib at different concentrations for 2 h, followed by stimulation with 60 ng/ml VEGF for 1 hour. (C) Representative IF staining images of VE-cadherin (green) in HUVECs treated with lenvatinib at different concentrations for 2 h, followed by stimulation with 60 ng/ml VEGF for 1 hour. (D) CCK-8 assay showing the proliferation of the indicated HBVPs with different treatments at different time points. (E) The OD450 value of the indicated HBVPs after different treatments for 72 h. (F) Representative images of the indicated HBVPs assessed by the Transwell migration assay after different treatments for 72 h. (G) Statistical graphs of migrated HBVPs assessed by the Transwell migration assay after different treatments for 72 h. (H, I) Fluorescently-labeled pericytes (green) were plated together with red-labeled endothelial cells (ECs) onto Matrigel at a 4:1 (EC: pericyte) ratio, cultured for 24 h (H) and 48 h (I), and the resulting vessel-like structures were analyzed by fluorescent microscopy. The error bars represent the mean ± SD. *P < 0.05; **P < 0.01; *** P < 0.001; ****P < 0.0001; ns indicates non-significant.

