
FIGURE 10.
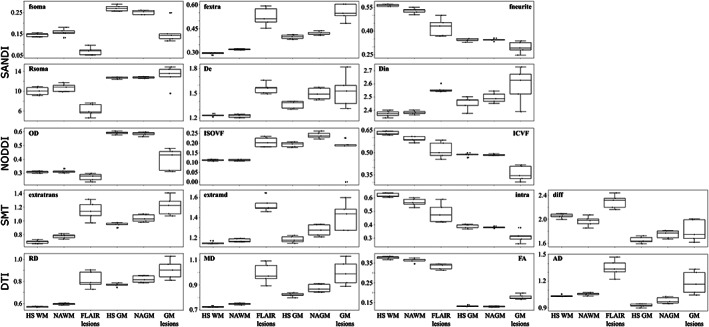
Clinical application. Box plots comparing SANDI, NODDI, SMT, and DTI metrics between five healthy subjects (HS) white matter (WM) and gray matter (HS GM) with normal‐appearing white and gray matter (NAWM and NAGM), white matter FLAIR hyperintense lesions, and GM lesions of five patients affected by multiple sclerosis (MS). Values of single subjects are displayed as dots for both groups. Diffusivities are in μm2/ms and Rsoma in μm. We observe that the lack of description of the cell body compartment prevents NODDI, SMT, and DTI to clearly identifying the different mechanisms underlying NAWM and WM FLAIR hyperintense lesions microstructural alterations, while SANDI metrics describe a different trend of damage according to the specific region. It is worth noting, in gray matter, the not easily interpretable increased FA in lesions compared to NAGM found with DTI which is in contradiction with the decrease in ICVF found by NODDI.