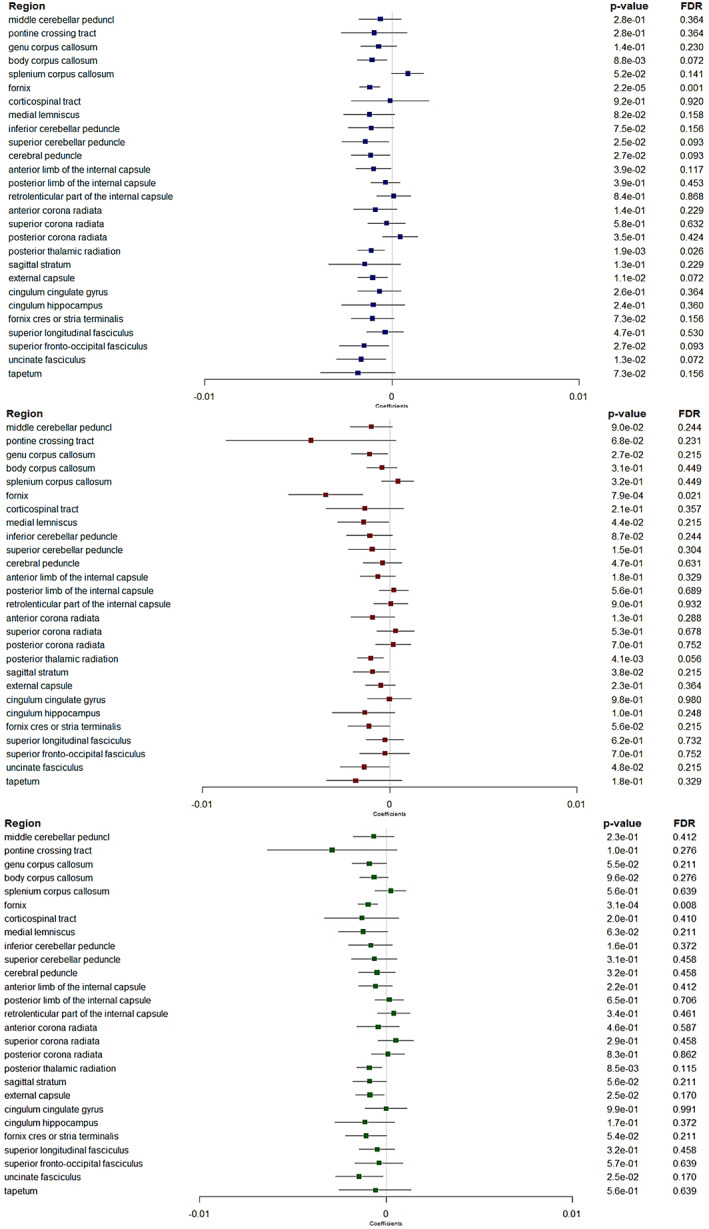
FIGURE 5.

Forest plots showing associations between retinal layers and orientation dispersion index. Boxes represent coefficients and horizontal lines represent 95% Confidence Intervals (non‐corrected). peripapillary RNFL (blue). GC‐IPL (red). GCC (green). Multiple linear regression models adjusted for sex, age, axial length of the eye, pulse pressure, body mass index, smoking status and total intracranial volume. A negative β coefficient corresponds to a decrease in orientation dispersion index better WM microstructure integrity, per one standard deviation increase in the retinal sublayer thickness. FDR, false discovery rate. Dichotomous retinal layers in the regions: GC‐IPL and GCC for the pontine crossing tract.
