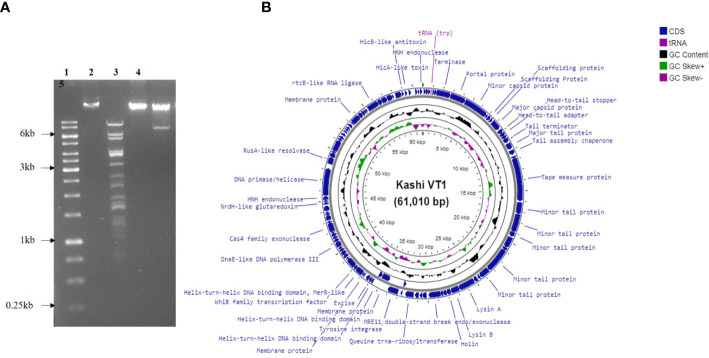
Figure 2.
Genomic DNA isolation, restriction digestion analysis, and genome map of KVT1. (A) Genomic DNA of phage KVT1 was subjected to restriction digestion by three restriction enzymes, namely, Pst1, Hind III, and Bam H1. Lane 1, DNA marker; lane 2, genomic DNA undigested; lane 3, Pst I; lane 4, Hind III; lane 5, Bam HI. (B) Complete genome map of KVT1 consists of 61,010 base pairs. KVT1 dsDNA, visualized by Proksee GC viewer tool (http://stothard.afns.ualberta.ca/cgview_server/). ORFs encoding all genes, annotated genes, tRNA, and total GC content are depicted in sky blue, red, violet, and black colors, respectively.

