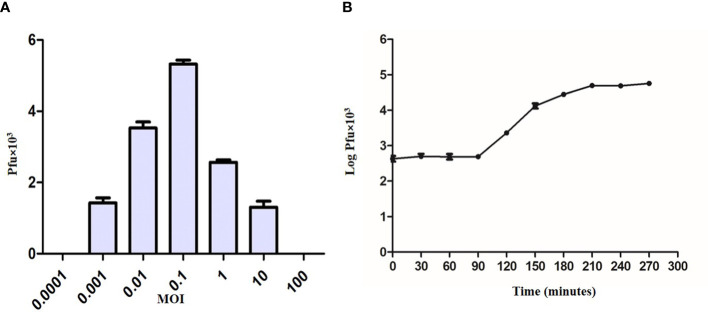
Figure 3.
Multiplicity of infection and one-step growth assay of bacteriophage KVT1. (A) Determination of multiplicity of infection (MOI) of KVT1. The X-axis represents MOI, whereas the Y-axis represents the PFU of the phage KVT1. Optimum MOI for the phage KVT1 was determined to be 0.1. (B) One-step growth curve assay of the bacteriophage KVT1. The X-axis represents time in minutes, whereas the Y-axis represents the log PFU (× 103) of the phage KVT1. The latent period and the burst size of phage KVT1 were determined to be 90 min and 102, respectively. The plateau phase of the growth reached after 180 min of the infection.

