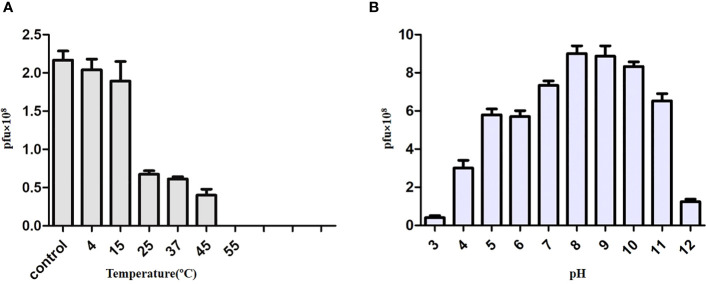
Figure 4.
Effect of temperature and pH on the stability and viability of the phage KVT1. (A) Effect of temperature on the phage KVT1. The X-axis represents temperature in degree centigrade, whereas the Y-axis represents PFU (× 107) of KVT1. Maximum stability of the phage KVT1 was determined in the temperature range of 4°C–15°C, whereas the phage viability was up to 45°C. (B) Effect of pH on the phage KVT1. The X-axis represents pH, whereas the Y-axis represents PFU (× 107) of KVT1. The maximum stability of the phage KVT1 was determined in the pH range of 8 to 10, intermediate stability was in the pH range of 4 to 7 (acidic range) and at pH 11 (alkaline range), whereas the phage viability was minimum at pH 3 and 12.

