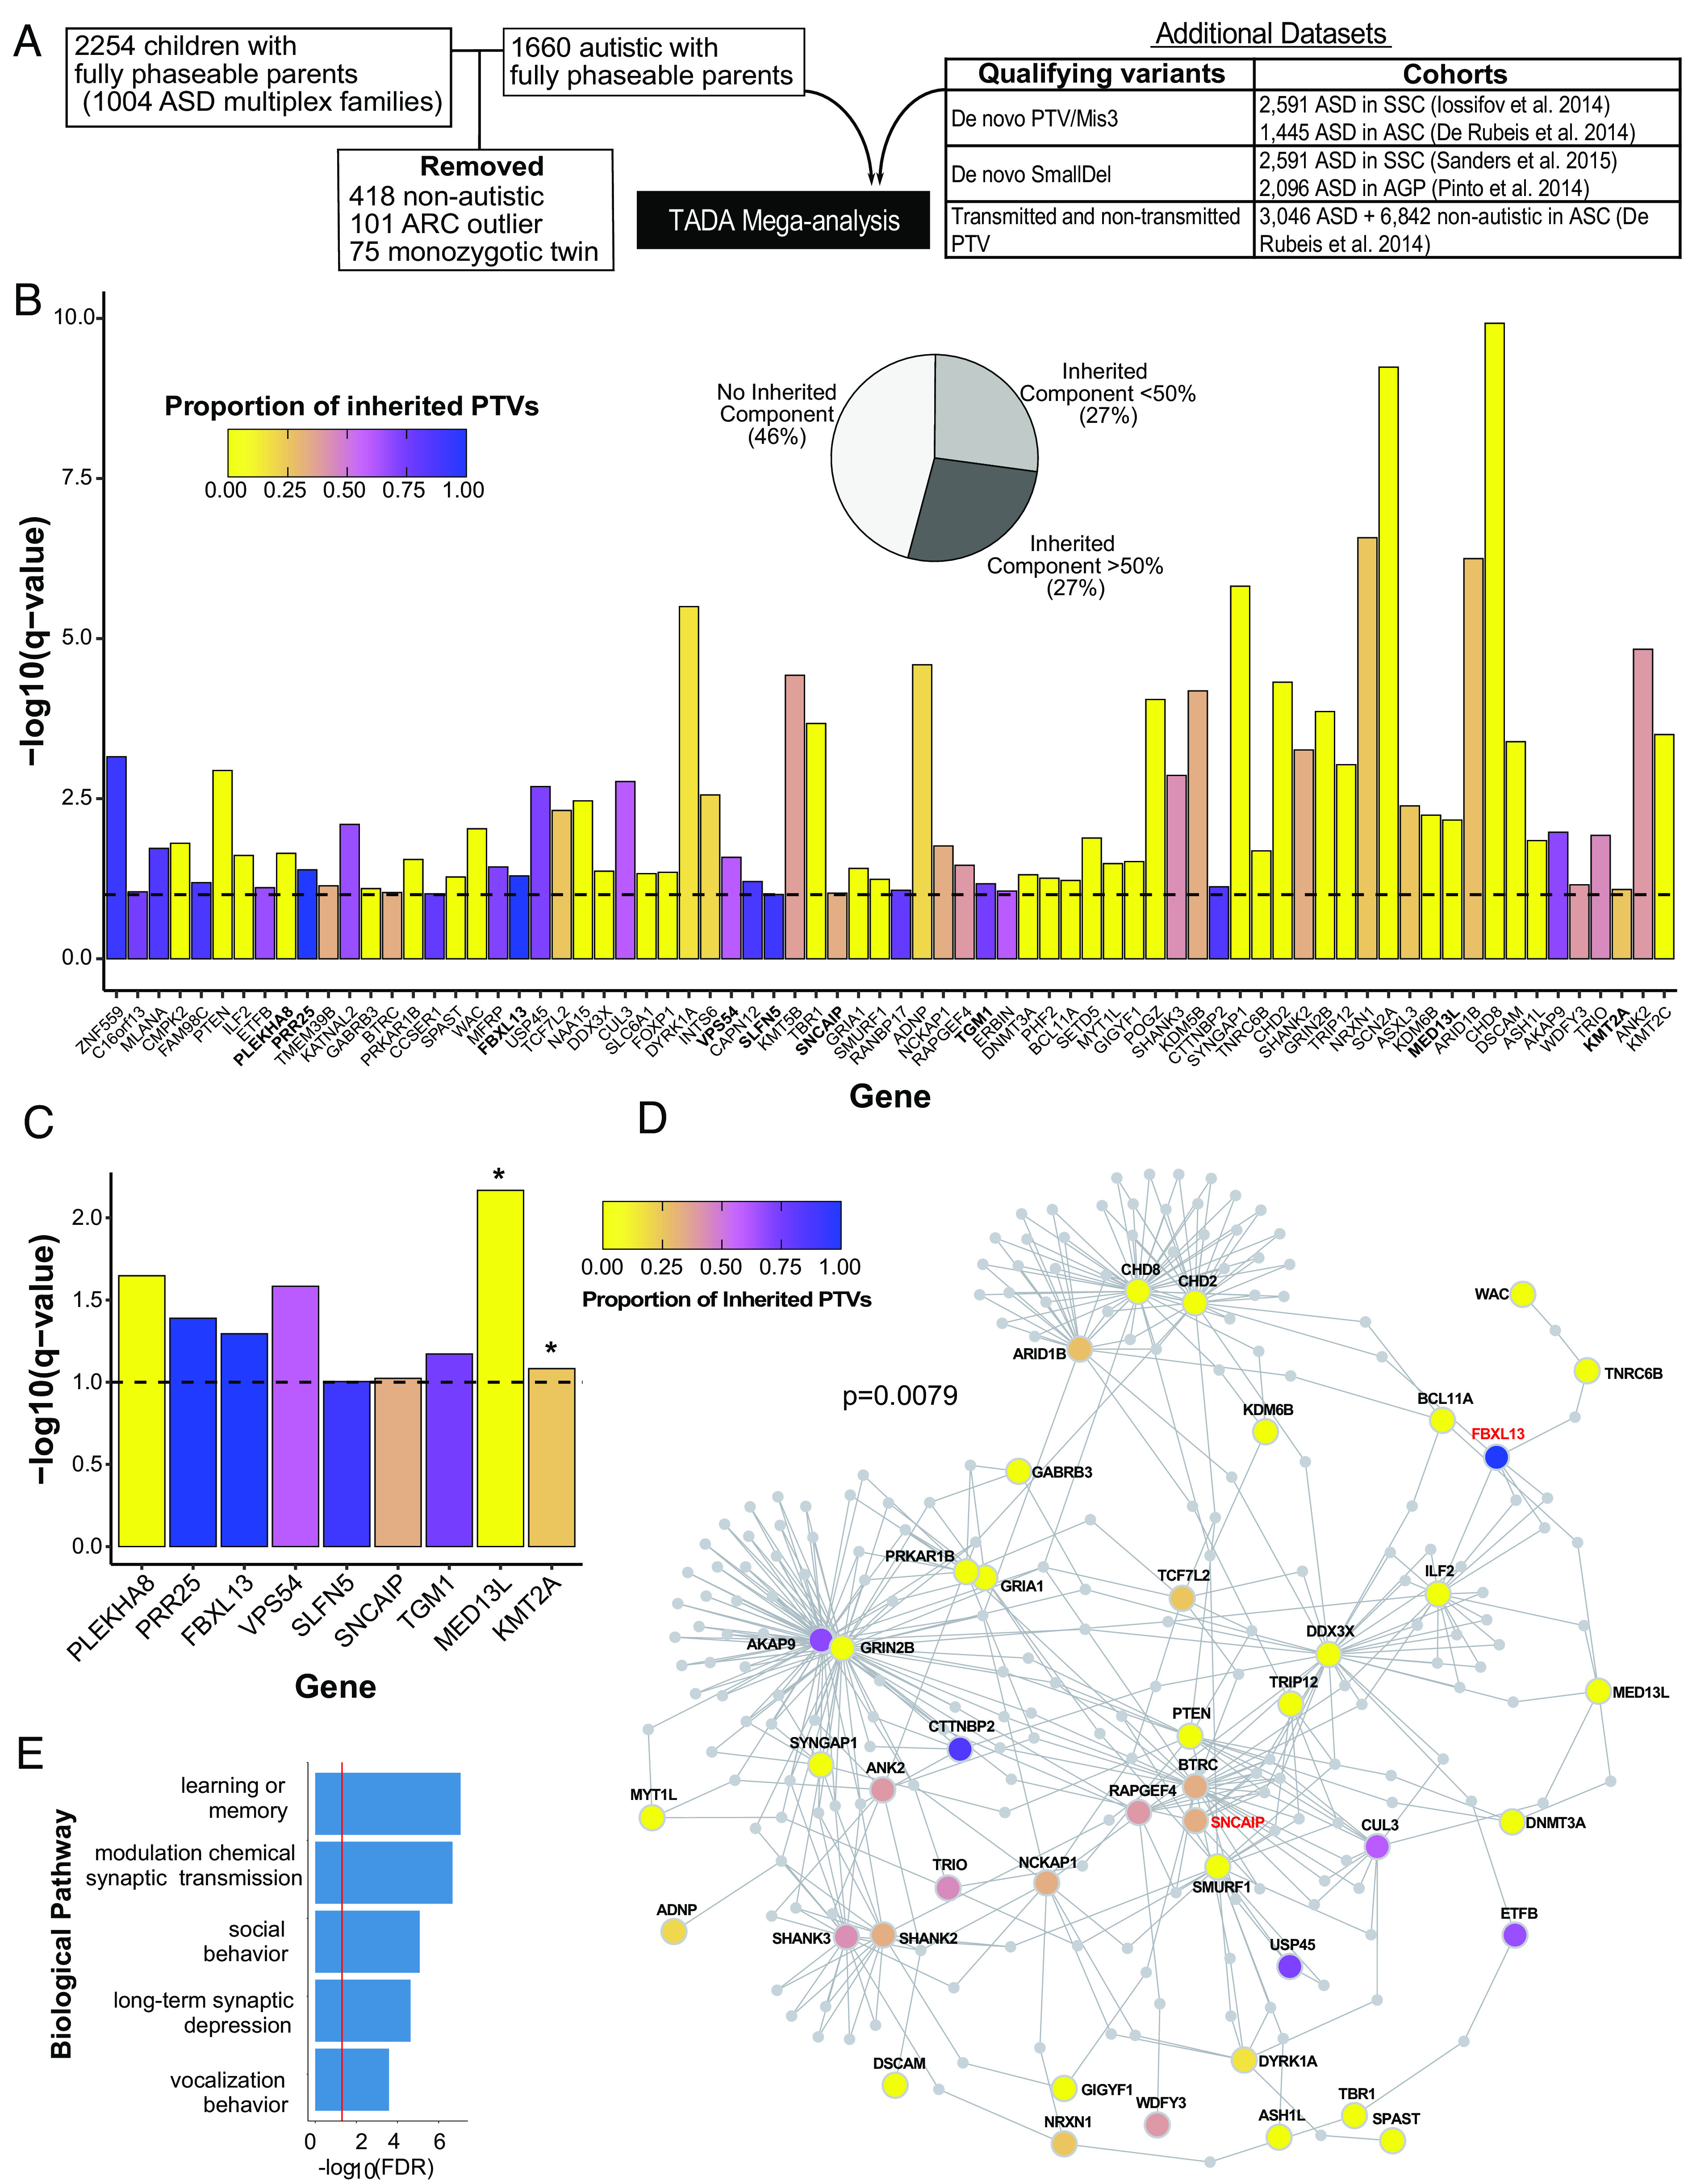
Fig. 2.

Seventy-four ASD risk genes identified by Transmission and De novo Association (TADA) analysis at FDR < 0.1. (A) Overview of cohort subjects and additional datasets included in the TADA analysis. (B) Seventy-four ASD risk genes identified in the TADA mega-analysis (FDR < 0.1) are displayed with corresponding −log10(q-value). The nine newly identified ASD risk genes from our expanded AGRE multiplex cohort in comparison to Ruzzo, et al (9) are in bold. The dashed horizontal line marks the FDR = 0.1 threshold. Bars are colored by the proportion of inherited protein-truncating variants (PTVs) for each gene (inherited PTVs/(inherited PTVs + de novo PTVs + de novo mis3 + de novo small deletions). The pie chart indicates the percentages of TADA genes with 0%, <50%, and >50% proportion of inherited PTVs. (C) The nine newly identified ASD risk genes from our expanded AGRE multiplex cohort in comparison to Ruzzo, et al (9). Bars are colored according to (B). Asterisks represent genes already identified in other recent cohort studies. Note how these genes have a very low proportion of inherited PTVs (mainly de novo support). The other seven genes are previously unrecognized risk genes for ASD. (D) Protein–protein interaction network formed by the 74 ASD risk genes using Disease Association Protein-Protein Link Evaluator (DAPPLE). Genes are colored by the proportion of inherited PTVs. The gene name for two of the seven previously unrecognized ASD risk genes are in red. (E) Gene Ontology enrichment terms for 39 significant seed genes from the protein–protein interaction network.
