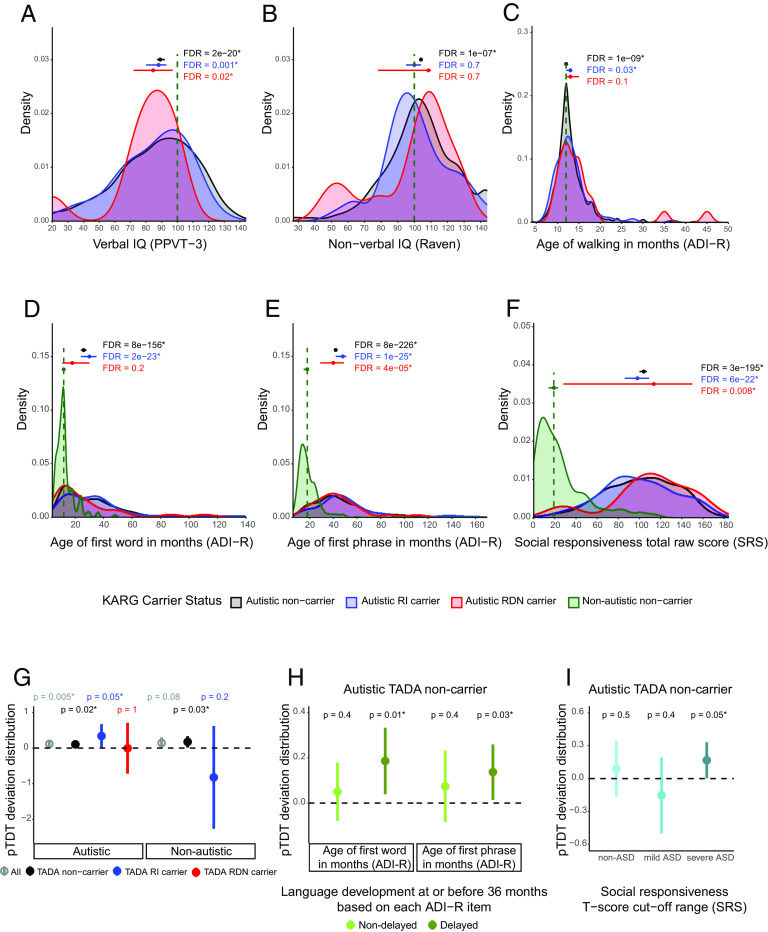
Fig. 4.
Phenotypic effect of rare and common risk for ASD in autistic children from AGRE multiplex families. (A–F) Phenotypic distributions in autistic children, stratified by those carrying rare inherited (RI) or rare de novo (RDN) variants in known ASD risk genes (KARGs) and those not carrying such variants. (A) Verbal IQ distribution for autistic children. Standard scores from PPVT-3 (Peabody Picture Vocabulary Test, 3rd edition) were used and compared to a standard hypothesized median value of 100. Autistic noncarrier: n = 767, mu = 89; autistic RI carrier: n = 70, mu = 88; autistic RDN carrier: n = 10, mu = 84.5. (B) Nonverbal IQ distribution for autistic children. Standard scores from the Raven test were used and compared to a standard hypothesized median value of 100. Autistic noncarrier: n = 987, mu = 104; autistic RI carrier: n = 98, mu = 100; autistic RDN carrier: n = 12, mu = 108.5. (C) Age of walking distribution for autistic children whose ADI-R (Autism Diagnostic Interview-Revised) data were available. A standard hypothesized median value of 12 mo was used for comparison (SI Appendix). Autistic noncarrier: n = 1180, mu = 12; autistic RI carrier: n = 120, mu = 13; autistic RDN carrier: n = 21, mu = 13. (D) Age of first word for autistic children whose ADI-R data were available. Autistic noncarrier: n = 1223, mu = 26; autistic RI carrier: n = 126, mu = 30; autistic RDN carrier: n = 21, mu = 18; nonautistic noncarrier: n = 295; mu = 12. (E) Age of first phrase for autistic children whose ADI-R data were available. Autistic noncarrier: n = 1220, mu = 42; autistic RI carrier: n = 126, mu = 48; autistic RDN carrier: n = 21, mu = 40; nonautistic noncarrier: n = 283; mu = 18. (F) SRS (Social Responsiveness Scale) total raw score distribution for autistic and nonautistic children. Autistic noncarrier: n = 709, mu = 104; autistic RI carrier: n = 73, mu = 98; autistic RDN carrier: n = 8, mu = 113.5; nonautistic noncarrier: n = 153; mu = 19. Noncarrier distributions are depicted in black, RI carrier ones in blue, and RDN ones in red. Standard hypothesized median values used for each phenotypic comparison are reported as green vertical lines. For D–F, these median values were derived from the corresponding phenotypic distributions for nonautistic noncarriers (shown in green) for whom phenotypic data were available. Each group of autistic children was tested for differences between its phenotypic median value and the standard hypothesized one by two-sided one-sample sign test. The three tests performed for each phenotypic measure were corrected for multiple hypothesis testing using the Benjamini and Hochberg (BH) procedure as an FDR-controlling method. An asterisk is used to denote an FDR < 0.05. Median values together with their 95% CI are represented by horizontal point ranges over the distributions. (G–I) ASD polygenic score transmission stratified by TADA gene carrier type and association with language and social impairment. (G) pTDT in autistic and nonautistic children, tested for all subjects (All - autistic: n = 1231; nonautistic: n = 288) and stratified by those carrying rare inherited (TADA RI carrier - autistic: n = 70; nonautistic: n = 8) or rare de novo (TADA RDN carrier - autistic: n = 12) variants in the 74 TADA genes and those without such variants (noncarriers - autistic: n = 1149; nonautistic: n = 279). (H) pTDT in autistic noncarriers of variants in the 74 TADA genes stratified by those with delayed (age of first word: n = 407; phrase: n = 564) language development (i.e., age of first word and phrase greater than 24 and 33 mo, respectively; SI Appendix) and those with nondelayed (age of first word: n = 432; phrase: n = 275) language development. (I) pTDT in autistic noncarriers of variants in the 74 TADA genes stratified by the degree of social impairment based on SRS (Social Responsiveness Scale) T-score cut-off ranges. T-scores (based on child’s sex) equal to 59 or less were considered non-ASD (n = 122), those 60 to 75 were considered mild ASD (n = 70), and those equal to or greater than 76 were considered severe ASD (n = 275). Polygenic transmission disequilibrium is shown on the y-axis of each panel as point ranges of the SD on the mid-parent distribution mean values together with their 95% CI. The probability of each pTDT deviation distribution mean being equal to zero was tested by a two-sided one-sample t-test. An asterisk is used to denote a P-value < 0.05.

