
Fig. 1.
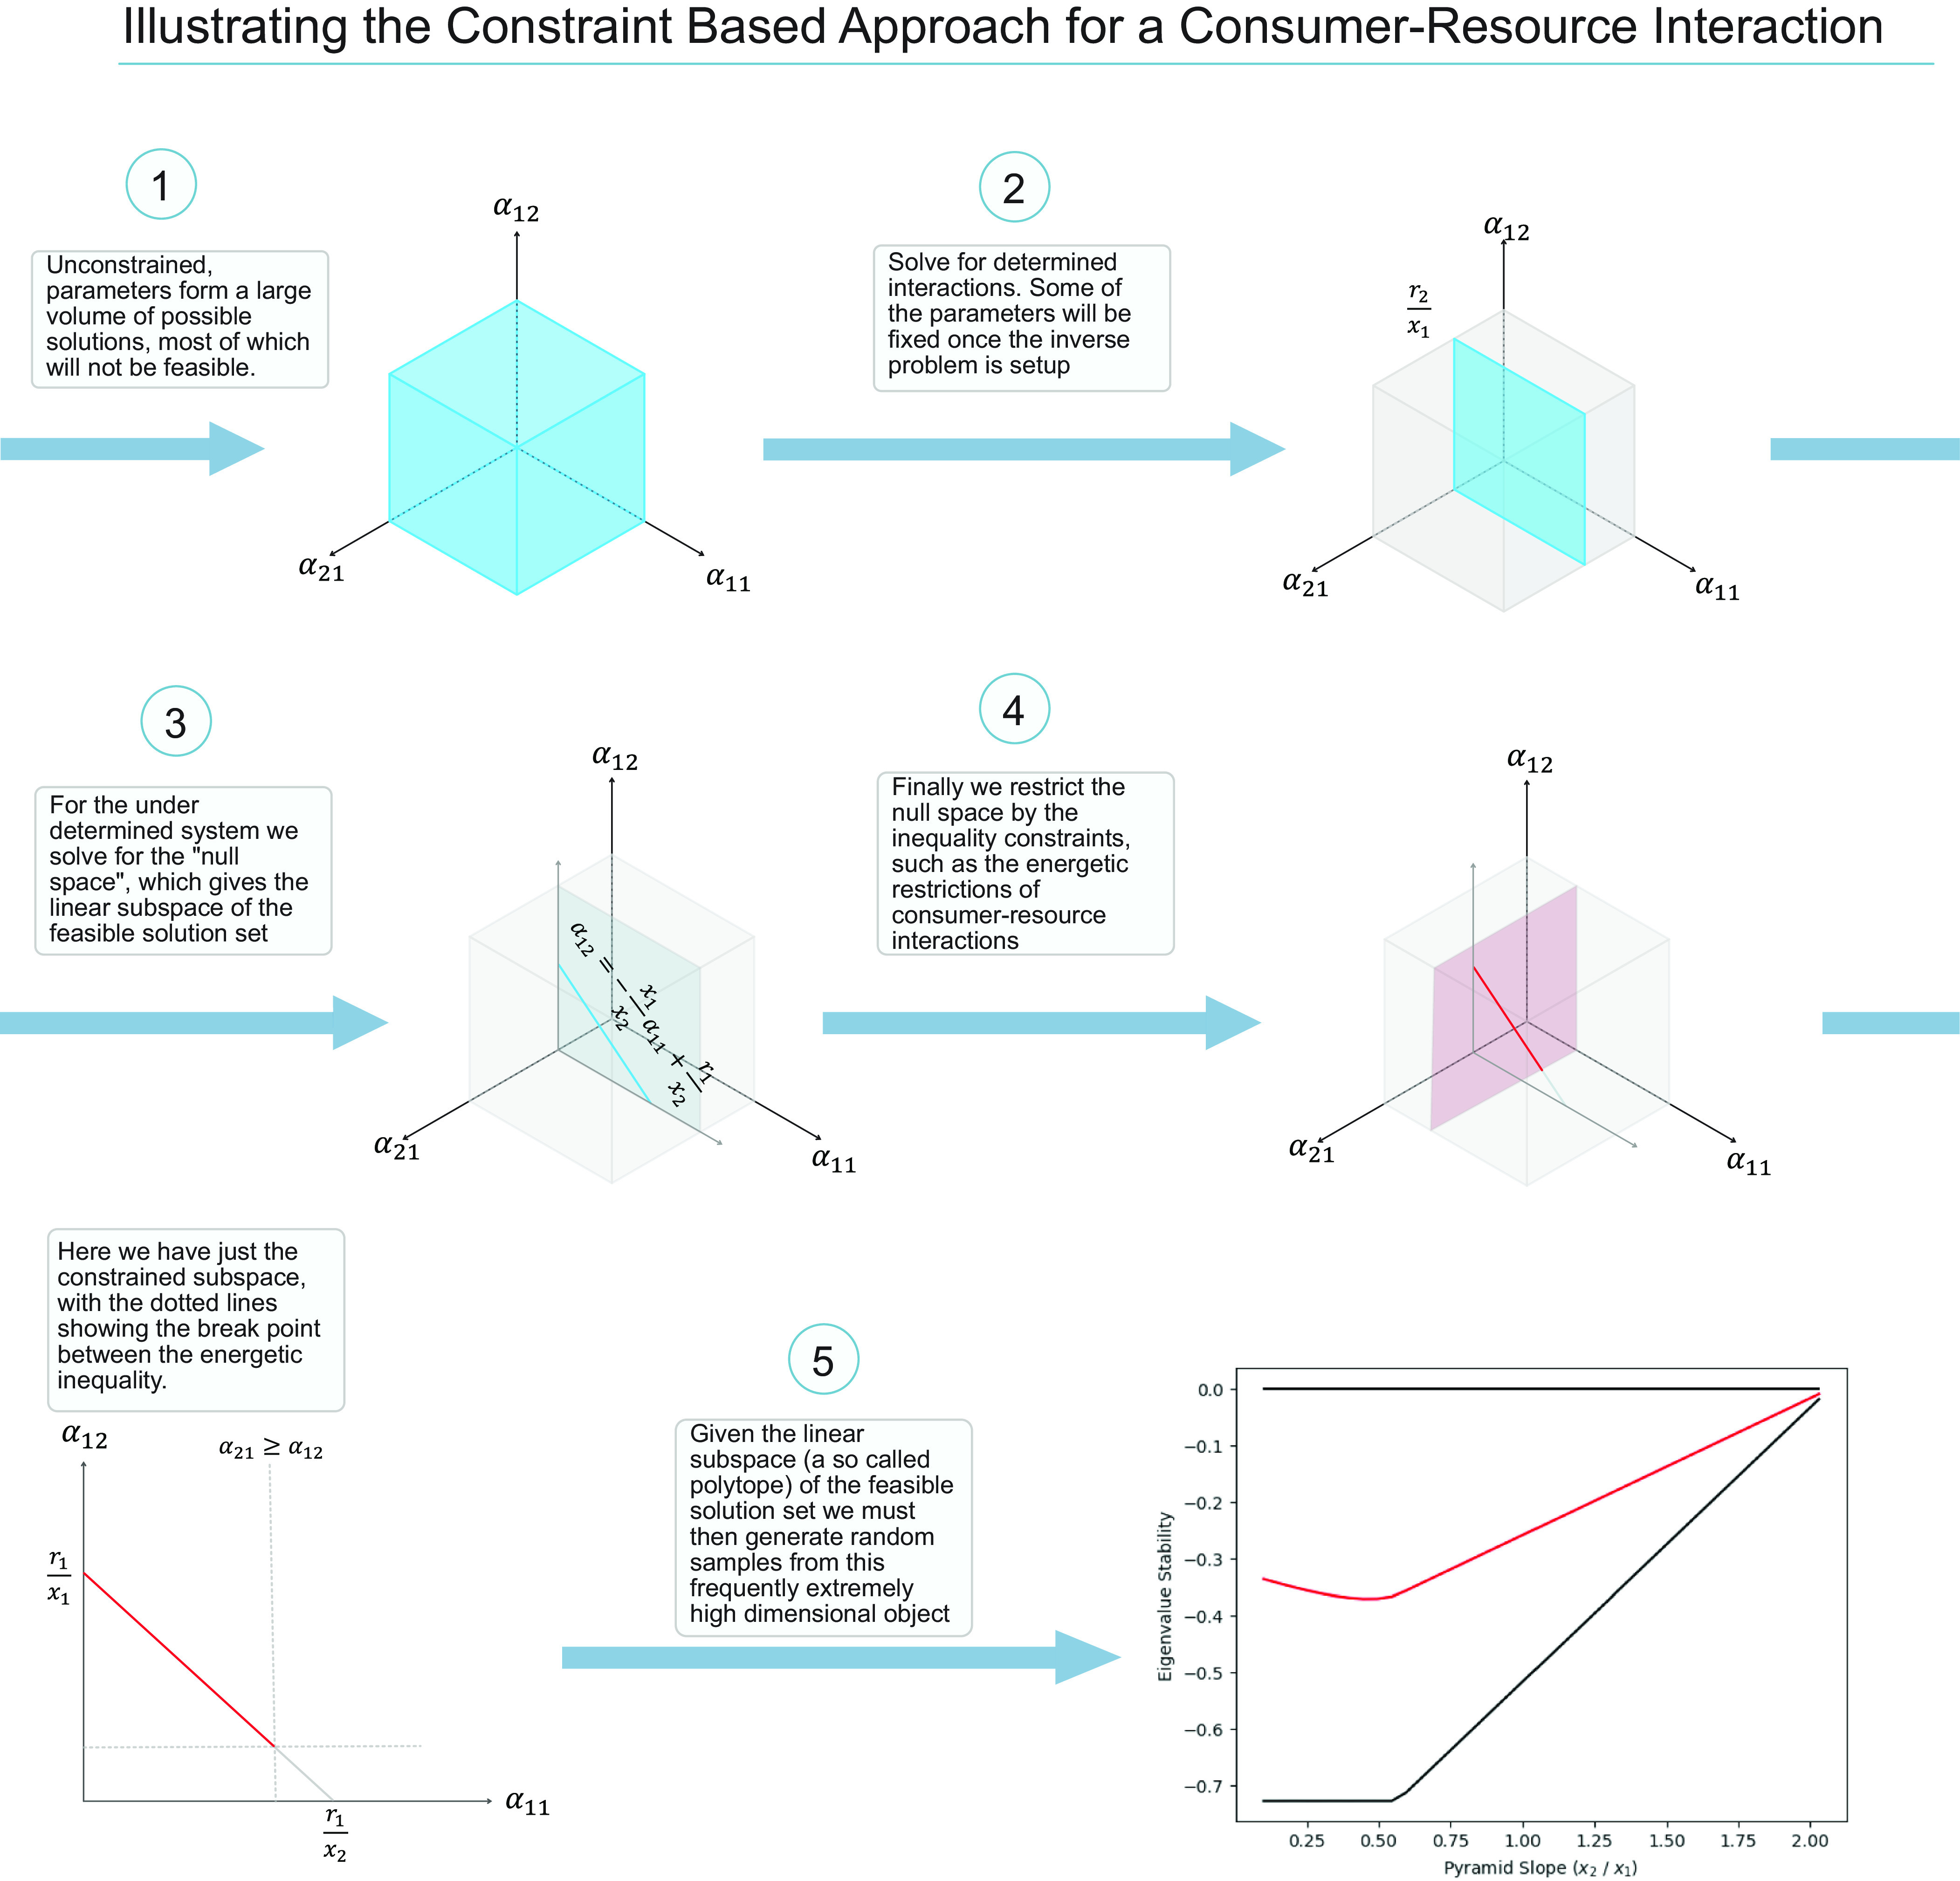
Overview of the mathematical approach used here that bridges the classical approach (1) to the inverse method under different constraints [just feasibility (3) and feasibility with an energetic constraint (5)] for the Lotka–Volterra consumer resource model. Circles 1–5 show the methodology of this paper which moves from the classical random model (1) via the inverse approach to feasible biological constrained models (5). In panel 5, the red line is the mean response of all runs when you are uniformly sampling from the blue line in panel 4, and the dark solid lines are the theoretical minimum and maximum stability responses (i.e., determined from the geometry in panel 4). The numerical values for panel 5 are r = [1.5, −0.5], x1 = 1, x2 in [1/3, 3].