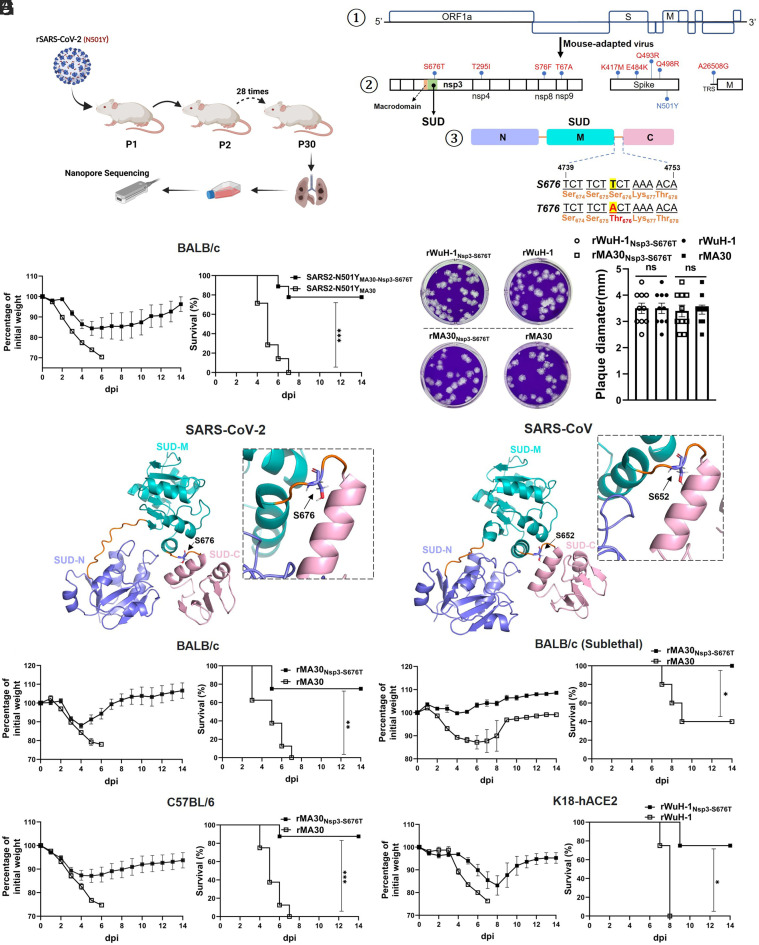
Fig. 1.
Nsp3-S676T substitution attenuates SARS-CoV-2 virulence in mice. (A) Schematic showing the generation of SARS2-N501YMA30-Nsp3-S676T in mice. SARS2-N501YMA30-Nsp3-S676T was generated by passage through mouse lungs as previously described (11). After 30 serial passages, the virus was collected from the lungs and then plaque purified three times on Vero E6 cells. Individual plaques were isolated, and viral genomes were sequenced by Nanopore sequencing. (B) Schematic diagram of SARS-CoV-2 genome (①), adaptive mutations in SARS2-N501YMA30-Nsp3-S676T (②), and SUD (③). The viral proteins containing mutations associated with mouse adaptation are shown in the middle panel (②). SUD-M, SUD-N, and SUD-C are colored purple, teal, and pink. Lower panel: The serine to threonine substitution at position 676 in Nsp3 is shown (③). (C) Percentage of initial weight and survival of BALB/c mice infected with 5,000 PFU of SARS2-N501YMA30 (n = 9 mice) or SARS2-N501YMA30-Nsp3-S676T (n = 7 mice). (D) Predicted structures of SUD of SARS-CoV-2 (Left) and SARS-CoV (Right). Globular domains, including SUD-M, SUD-N, and SUD-C, are colored in purple, teal, and pink, respectively. Linker regions between the globular domains are orange colored. Residue S676 is shown as a stick model (Inset). Corresponding residue in SARS-CoV SUD is S652. (E) Representative plaques of recombinant viruses in Vero E6 cells (Left). rSARS-CoV-2Nsp3-S676T, rSARS-CoV-2 (Wuhan-Hu-1), rSARS2-N501YMA30-Nsp3-S676T, and rSARS2-N501YMA30 (named rWuH-1Nsp3-S676T, rWuH-1, rMA30Nsp3-S676T, and rMA30, respectively in text). Comparison of the diameter of plaques from different viruses (Left) (10 plaques each group). (F and G) Weight and survival of BALB/c mice challenged with 5,000 PFU (F) or 500 PFU (G) of rMA30Nsp3-S676T or rMA30 (F. n = 8 mice/group. G. n = 5 mice/group). (H) C57BL/6 mice were infected with 5,000 PFU of rMA30 or rMA30Nsp3-S676T. Weight and survival were monitored daily until 14 dpi (n = 8 mice each group). (I) K18-ACE2 mice were inoculated with 2,000 PFU of rWuH-1 or rWuH-1Nsp3-S676T (n = 4 mice each group). Weight and survival were recorded daily until 14 dpi. P values were determined by a log-rank (Mantel–Cox) test and a two-tailed, unpaired t test with Welch’s correction. Data are combined from two independent experiments.

