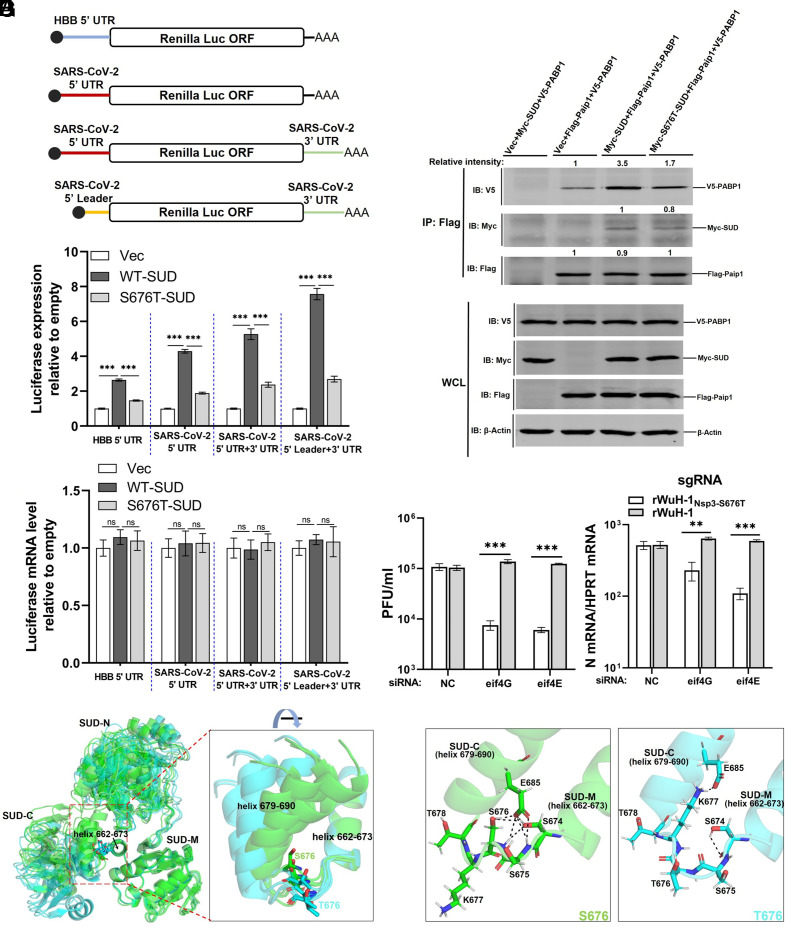
Fig. 4.
Nsp3-S676T diminishes the translational stimulatory ability of SUD. (A) Schematic diagram of luciferase reporters. Human beta-globin (HBB), SARS-CoV-2 5′ UTR, or 5′ leader was positioned upstream of the Renilla luciferase gene in pRL-TK. The SARS-CoV-2 3′ UTR was inserted downstream of the Renilla luciferase in plasmids containing the 5′ UTR or 5′ leader. (B and C) Quantification of Renilla luciferase expression. HEK-293T cells were transfected with HBB-5’ UTR or SARS-CoV-2 5′ UTR Renilla-Luc and vector, SUD or S676T-SUD. After 24 h, cells were lysed in 1× lysis buffer for measuring luciferase activity (B, n = 5 replicates, representative of three independent experiments) or in TRIzol to evaluate mRNA levels of luciferase using qRT-PCR (C, n = 4 replicates, representative of two independent experiments). (D) HEK293 cells were transfected with vector, myc-SUD, or myc-S676T-SUD, together with V5-PABP1 and Flag-Paip1. As a control, cells were transfected with vector, myc-SUD, and V5-PABP1. After 24 h, transfected cells were lysed and immunoprecipitated with Pierce™ Anti-Flag Affinity Resin. Intensity of PABP1 or SUD was normalized to Paip1 in the same immunoprecipitation. Intensity of Paip1 relative to the vector group is shown (second lane from left). (E) Vero E6 cells were transfected with 40 nM of NC (negative control siRNA) siRNA, eIF4E siRNA or eIF4G siRNA, prior to infection 48 h later with 0.05 PFU/cell of rWuH-1 or WTNsp3-S676T. At 24 hpi, supernatants were collected for virus plaque assay, and cells were harvested with TRIzol to measure viral sgRNA levels by qRT-PCR (n = 3 replicates, representative of two independent experiments). (F) Predicted structures of the SUD domains of nsp3-S676 and nsp3-T676 were superimposed using all five top-ranked structures shown in SI Appendix, Fig. S4, based on helix 662-673. S676 and T676 SUD are colored in green and cyan, respectively. Residues S676 and T676 are shown in a stick model. (G) Predicted hydrogen bonds were identified using each of the rank 1 predicted structures (SI Appendix, Fig. S4), based on analyses of S674, S675, S676/T676, K677, and E678. Left: S676. Right, T676. Hydrogen bonds are shown as black dashed lines. Statistical significance was determined by a one-way ANOVA test with Tukey's multiple comparisons test (B and C) and a two-tailed, unpaired t test with Welch’s correction (E).

