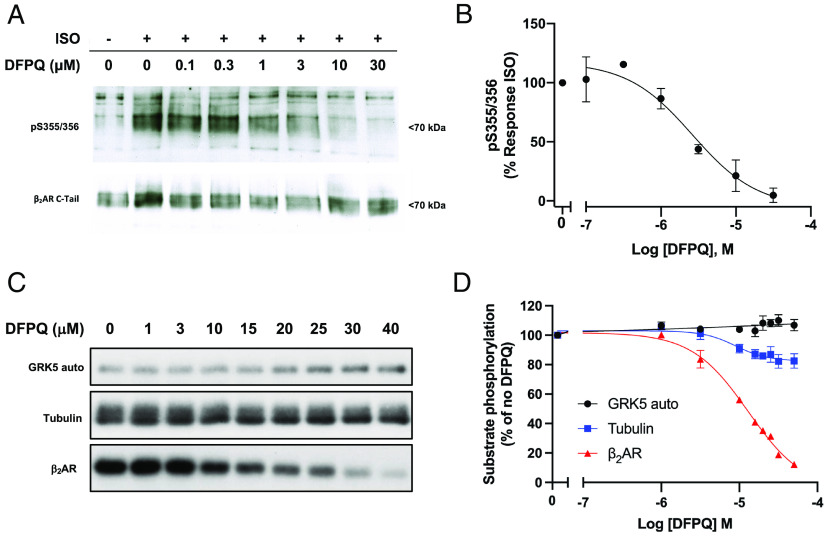
Fig. 3.
DFPQ inhibits GRK-mediated phosphorylation of the β2AR. (A) Representative time course of agonist promoted phosphorylation of the β2AR. HEK 293 cells stably expressing FLAG-β2AR were preincubated with 0.1% DMSO or indicated concentrations of DFPQ for 30 min and then stimulated with 1 μM ISO for 10 min. Cells were lysed and the FLAG-β2AR was immunoprecipitated. Phosphorylation at serine 355 and 356 was analyzed by western blot using a pSer355/356 antibody while total β2AR was measured using a β2AR C-terminal antibody. The western blot is representative of at least three experiments. (B) Densitometric quantification for concentration–activity curve-fitting from panel A is shown. Data are normalized to 1 μM ISO and are the mean % ± SEM, n = 3. (C) A representative autoradiograph of GRK5 autophosphorylation and GRK5-mediated phosphorylation of tubulin and the β2AR in the presence of 1 μM ISO and the indicated concentration of DFPQ. The apparent small increase in GRK5-autophosphorylation was not consistent across the three replicates, as shown by the average quantification in panel D. (D) In vitro phosphorylation data from three experiments were quantified and are shown as a percentage of no DFPQ. Data are mean ± SEM, n = 3. Concentration–activity curves were generated by fitting the western blot densitometric data to the logistic equation log(inhibitor) vs. response (three parameters) while data from autoradiography were fit using the logistic equation log(inhibitor) vs. response (four parameters, variable slope). All curves were generated using GraphPad Prism.

